Bar Diagrams for Problem Solving. Create event management bar charts with Bar Graphs Solution

Bar Graph

The vector stencils library "Picture bar graphs" contains 35 templates of pictorial charts. Use it for visualization of data comparison and time series with ConceptDraw PRO diagramming and vector drawing software.
"Pictorial bar graph.
Sometimes reffered to as a pictographs. A pictorial bar graph is a graph in which the rectangular bars have been filled with pictures, sketches, icons, etc. or where pictures, sketches, icons, etc. have been substituted for the rectangular bars. In both variations, one or more symbols might be used in each bar. The two major reasons for using pictorial graphs are to make the graph more appealing visually and to facilitate better communications." [Information Graphics: A Comprehensive Illustrated Reference. R. L. Harris. 1999. p.41]
The pictorial charts example "Design elements - Picture bar graphs" is included in the Picture Graphs solution from the Graphs and Charts area of ConceptDraw Solution Park.
Templates

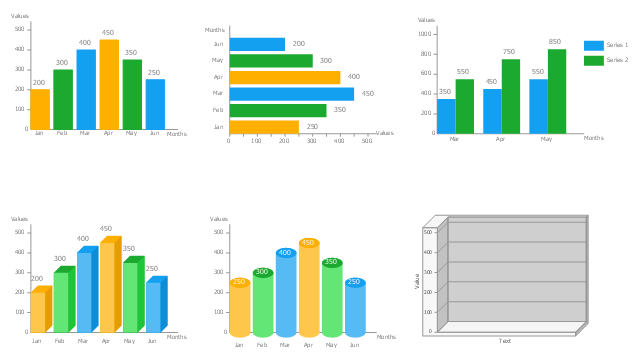
Bar Chart

The vector stencils library Bar charts contains templates you can simply drag from the library to your document in the the ConceptDraw PRO diagramming and vector drawing software, and add your data.
"A bar chart or bar graph is a chart with rectangular bars with lengths proportional to the values that they represent. The bars can be plotted vertically or horizontally. A vertical bar chart is sometimes called a column bar chart. ...
A bar graph is a chart that uses either horizontal or vertical bars to show comparisons among categories. One axis of the chart shows the specific categories being compared, and the other axis represents a discrete value. Some bar graphs present bars clustered in groups of more than one (grouped bar graphs), and others show the bars divided into subparts to show cumulate effect (stacked bar graphs)." [Bar chart. Wikipedia]
The graph template set "Design elements - Bar charts" is included the Basic Bar Graphs solution from the Graphs and Charts area of ConceptDraw Solution Park.
Bar graph templates
 Bar Graphs
The Bar Graphs solution enhances ConceptDraw PRO v10 functionality with templates, numerous professional-looking samples, and a library of vector stencils for drawing different types of Bar Graphs, such as Simple Bar Graph, Double Bar Graph, Divided Bar Graph, Horizontal Bar Graph, Vertical Bar Graph, and Column Bar Chart.
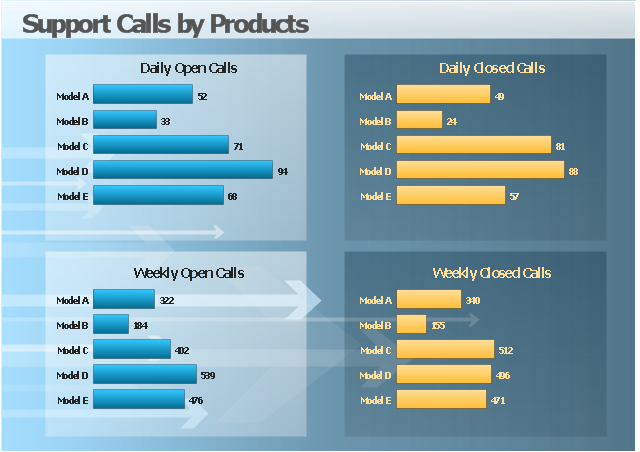
Bar Chart Template

The business dashboard example "Support calls by products" contains 4 horizontal bar charts used for the comparison of support calls data by products.
"A bar chart or bar graph is a chart with rectangular bars with lengths proportional to the values that they represent. The bars can be plotted vertically or horizontally. A vertical bar chart is sometimes called a column bar chart. ...
A bar graph is a chart that uses either horizontal or vertical bars to show comparisons among categories. One axis of the chart shows the specific categories being compared, and the other axis represents a discrete value." [Bar chart. Wikipedia]
The visual dashboard example "Support calls by products" was created using the ConceptDraw PRO diagramming and vector drawing software extended with the Comparison Dashboard solution from the area "What is a Dashboard" of ConceptDraw Solution Park.
Visual dashboard
The vector stencils library "Picture Graphs" contains 4 image chart templates. Use it to design your pictorial bar charts in ConceptDraw PRO diagramming and vector drawing software.
"Pictorial bar graph.
Sometimes reffered to as a pictographs. A pictorial bar graph is a graph in which the rectangular bars have been filled with pictures, sketches, icons, etc. or where pictures, sketches, icons, etc. have been substituted for the rectangular bars. In both variations, one or more symbols might be used in each bar. The two major reasons for using pictorial graphs are to make the graph more appealing visually and to facilitate better communications." [Information Graphics: A Comprehensive Illustrated Reference. R. L. Harris. 1999. p.41]
The chart templates example "Design elements - Picture graphs" is included in the Basic Picture Graphs solution from the Graphs and Charts area of ConceptDraw Solution Park.
Pictorial chart templates

Column Chart Template

- How to Draw a Divided Bar Chart in ConceptDraw PRO | Bar Chart ...
- How to Draw a Divided Bar Chart in ConceptDraw PRO | Subdivided ...
- How to Draw a Divided Bar Chart in ConceptDraw PRO | Basic ...
- Design elements - Picture bar graphs | Bar Chart Examples | Bar ...
- What Id A Rectangular Bar Graph
- | Advantages Of Divided Rectangle Bar Graph
- How to Draw a Divided Bar Chart in ConceptDraw PRO | Divided ...
- Divided Bar Diagrams | How to Draw a Divided Bar Chart in ...
- Diagramatic Of Divided Bar Graph