ConceptDraw PROJECT Software Overview

 macOS User Interface
macOS User Interface solution extends the ConceptDraw DIAGRAM functionality with powerful GUI software graphic design features and tools. It provides an extensive range of multifarious macOS Sierra user interface design examples, samples and templates, and wide variety of libraries, containing a lot of pre-designed vector objects of Mac Apps icons, buttons, dialogs, menu bars, indicators, pointers, controls, toolbars, menus, and other elements for fast and simple designing high standard user interfaces of any complexity for new macOS Sierra.
 ConceptDraw Solution Park
ConceptDraw Solution Park collects graphic extensions, examples and learning materials
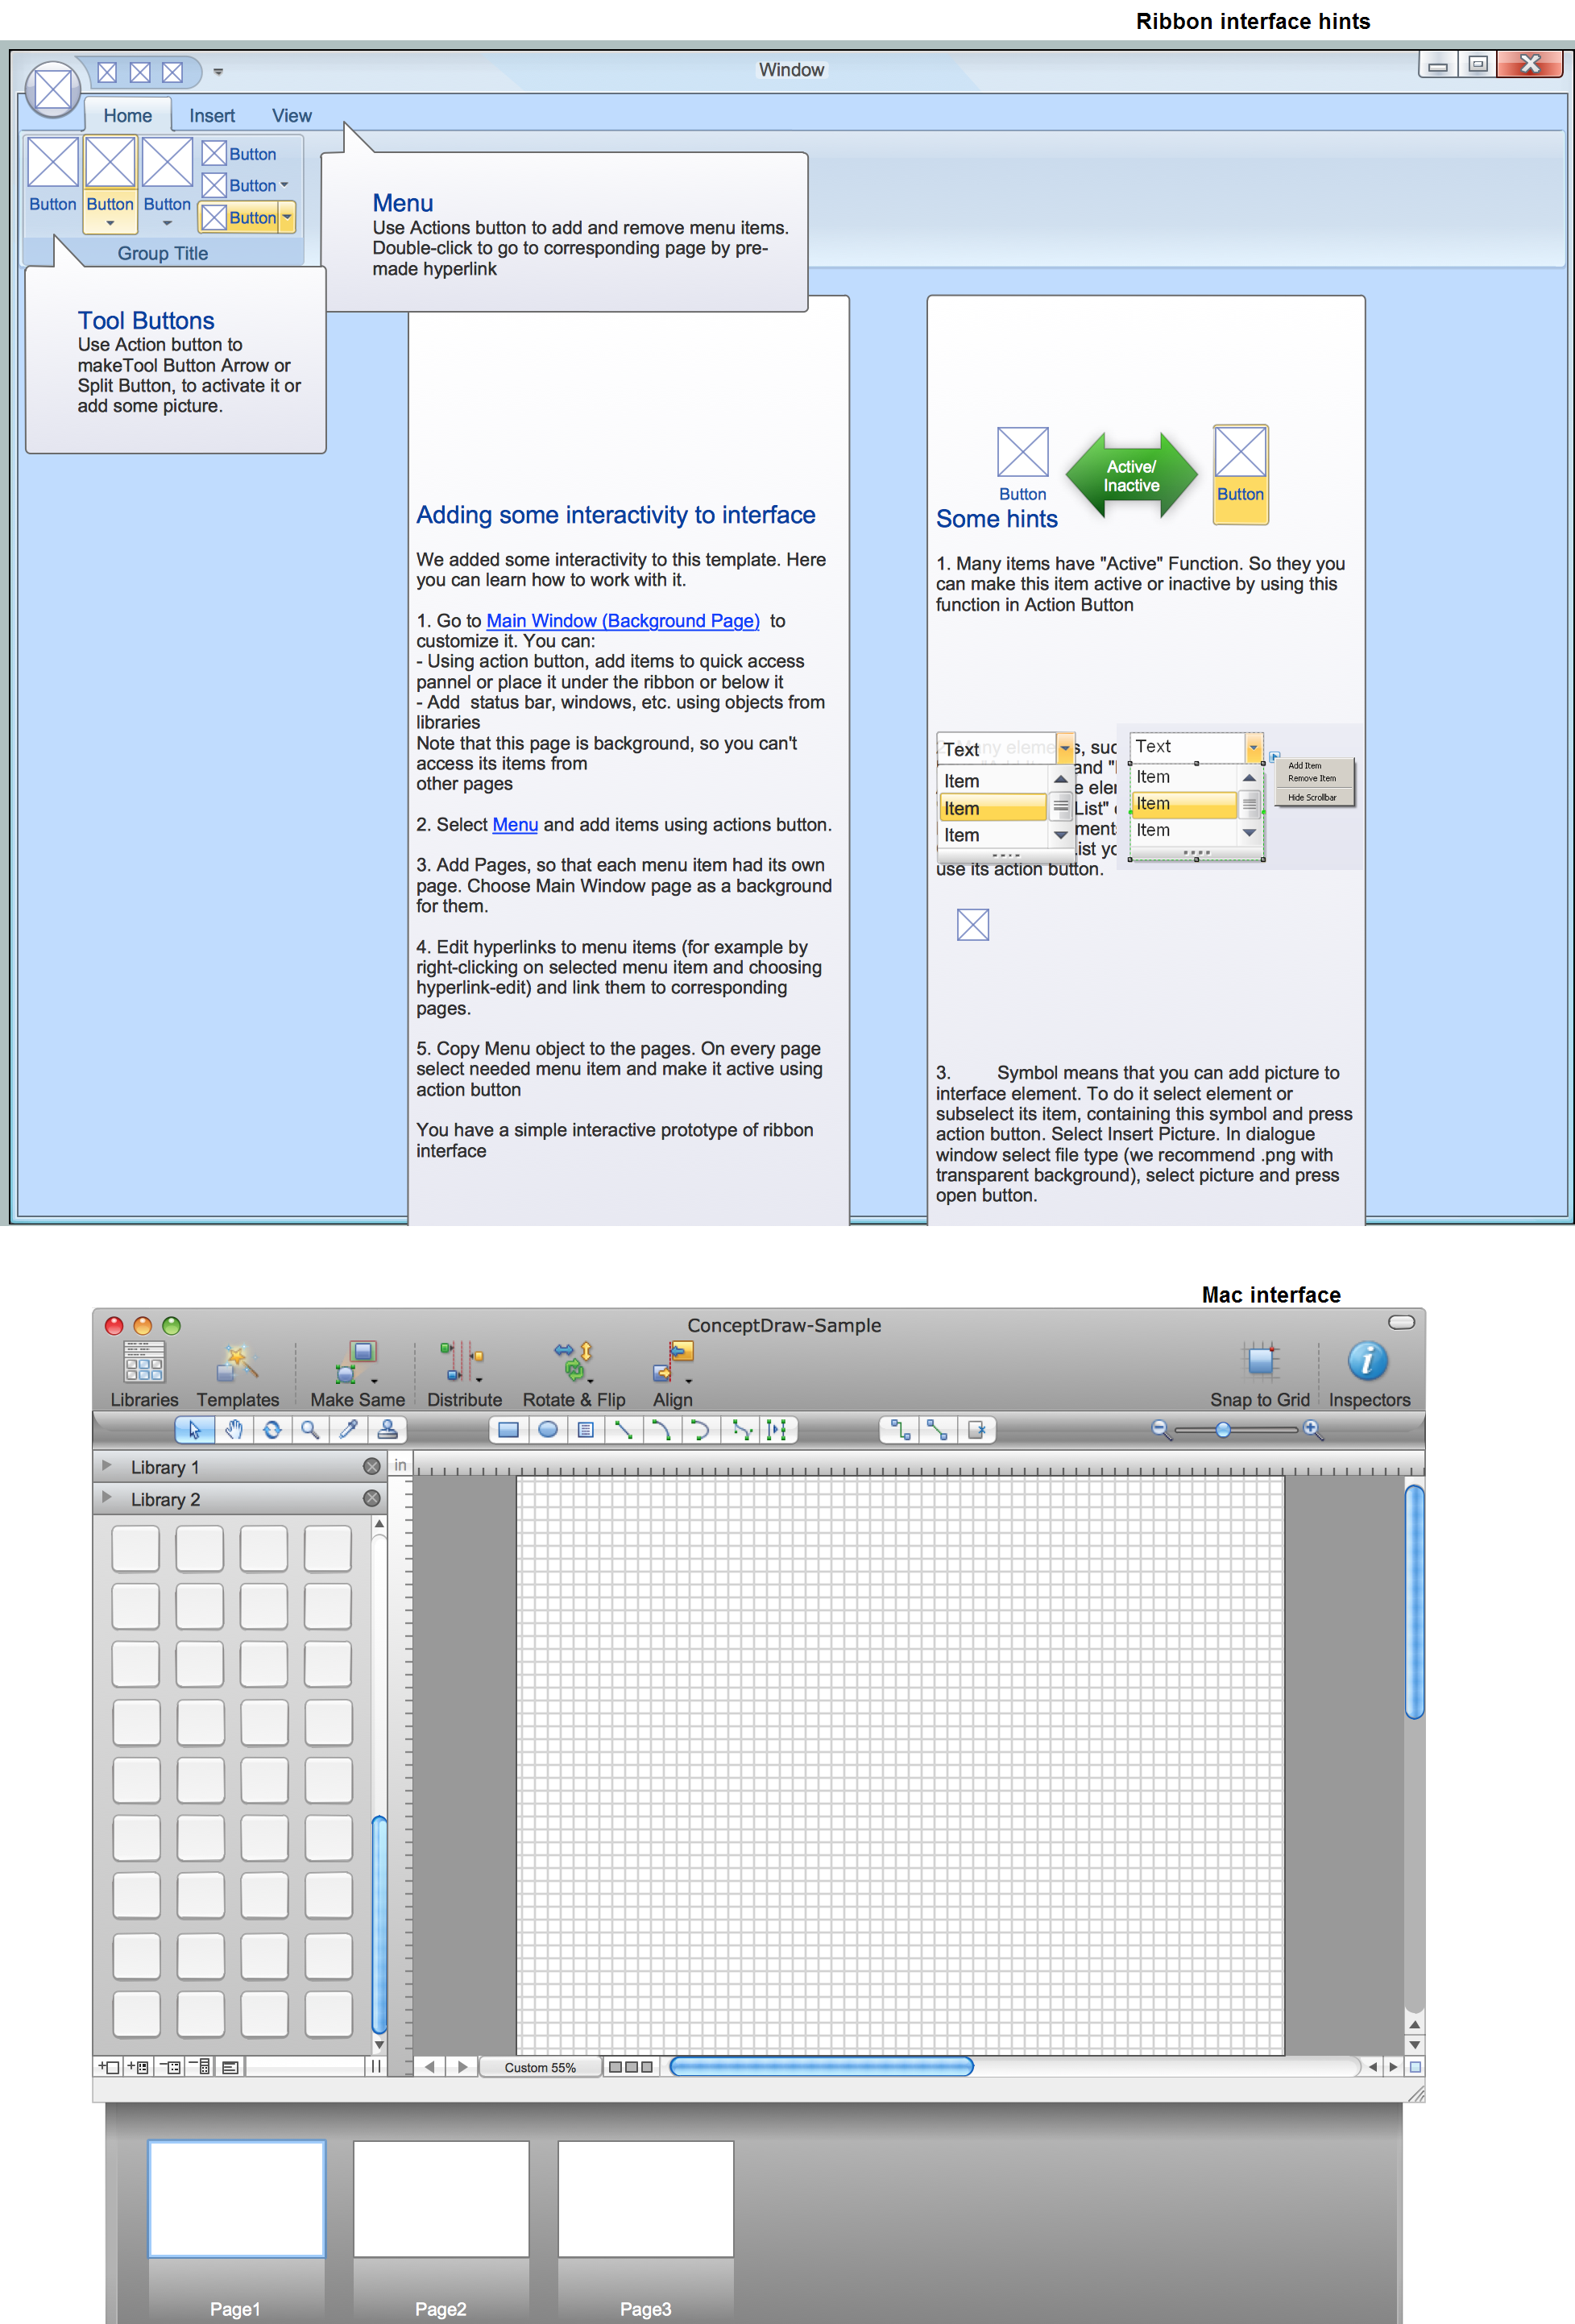
GUI Prototyping with ConceptDraw DIAGRAM
 25 Typical Orgcharts
The 25 Typical Orgcharts solution contains powerful organizational structure and organizational management drawing tools, a variety of professionally designed organization chart and matrix organization structure samples, 25 templates based on various orga
Business diagrams & Org Charts with ConceptDraw DIAGRAM


 PM Dashboards
The PM Dashboards solution extends the management boundaries of ConceptDraw DIAGRAM and ConceptDraw PROJECT products with an ability to demonstrate changes to the budget status, to show the project progress toward its objectives, to display clearly the identified key performance indicator (KPI) or the set of key performance indicators for any project. This solution provides you with examples and ability to generate three types of visual dashboards reports based on your project data Project Dashboard, Tactical Dashboard, and Radar Chart. By dynamically charting the project’s key performance indicators that are collected on one ConceptDraw DIAGRAM document page, all project participants, project managers, team members, team leaders, stakeholders, and the entire organizations, for which this solution is intended, have access to the daily status of projects they are involved in.
 PM Presentations
The PM Presentations solution extends the power of ConceptDraw MINDMAP , ConceptDraw DIAGRAM , and ConceptDraw PROJECT, improving their efficiency at many stages of the project management process by using the same source data to construct the targeted presentation for your audience and clearly communicating the appropriate information to different audiences from a single source. It gives an ability to project managers and other team participants to create and to deliver capacious presentations representing the data and knowledge of a specific project with the help of including visual dashboards, Gantt charts, resource views, maps, timelines, calendars, illustrations, project diagrams and reports of varied types. Having the possibility to edit collaboratively in a Full-Screen Mode, the teams can rapidly plan a project as well as execute the tasks of revising and making changes to it.
- Pyramid To Show Various Manager In Os
- Designing An Organogram Showing The Different Managerial
- An Organogram To Illustrate The Different Managerial Levels And
- Show The Diagram Of Different Type Of A Pyramid
- Management Area | Organizational Charts | 25 Typical Orgcharts ...
- Organizational Chart Template | Organogram That Illustrate The ...
- Designing A Organogram To Illustrate The Different Managerial Levels
- A Diagram Duscussing The Different Levels Of The Organization ...
- Organogram With Illustration And Different Managerial Levels And ...
- Pyramid Diagram
- 4 Level pyramid model diagram - Information systems types | 5 Level ...
- Pyramid Chart Examples | Efficiency Pyramid Model Example
- Organogram To Illustrate Different Managerial Levels
- Examples Of The Pyramid Model Used In Football
- The Organogram To Illustrate The Different Managerial Levels And
- Organogram To Illustrate The Different Managerial Level And Tasks
- Pyramid Diagram | Pyramid Diagram | 4 Level pyramid model ...
- Pyramid To Show Manager In Operating System
- Project Laboratory Diagram