 Marketing
This solution extends ConceptDraw PRO v9 and ConceptDraw MINDMAP v7 with Marketing Diagrams and Mind Maps (brainstorming, preparing and holding meetings and presentations, sales calls).
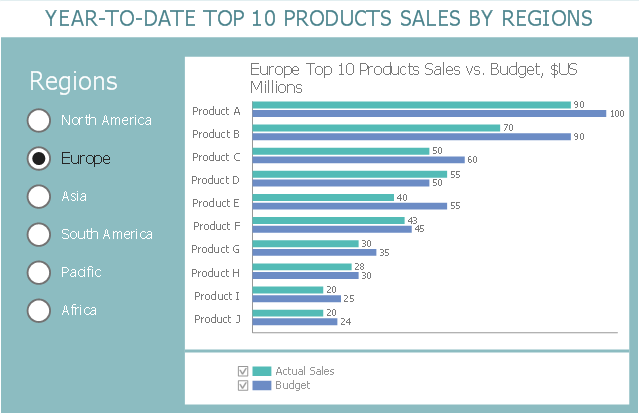
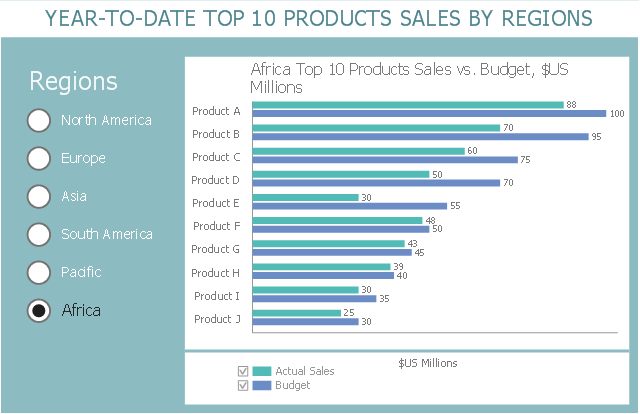
This business intelligence dashboard sample shows the year-to-date top 10 products sales by regions using horizontal bar charts.
"Dashboards often provide at-a-glance views of KPIs (key performance indicators) relevant to a particular objective or business process (e.g. sales, marketing, human resources, or production). In real-world terms, "dashboard" is another name for "progress report" or "report."" [Dashboard (business). Wikipedia]
The BI dashboard example "Year-to-date Top 10 Products Sales by Regions" was created using ConceptDraw PRO software extended with the Business Intelligence Dashboards solution from the Business Processes area of ConceptDraw Solution Park.
North America

Europe
Asia
South America
Pacific
Africa
 Sales Dashboard
Sales Dashboard solution extends ConceptDraw PRO software with templates, samples and library of vector stencils for drawing the visual dashboards of sale metrics and key performance indicators (KPI).
HelpDesk
How to Create a Sales Flowchart Using ConceptDraw PRO

- Sales Process Flowchart. Flowchart Examples | Sales Process ...
- Sales Process Flowchart. Flowchart Examples | Flowchart Marketing ...
- Product Sales Plan Flowchart
- Flowchart Marketing Process. Flowchart Examples | Flowchart ...
- Create Response Charts | Sales Process Flowchart. Flowchart ...
- Product Marketing Process Flow
- Product Sales System Analysis
- Marketing and Sales Organization chart. Organization chart Example
- Entity Relationship Diagram For Product Sales Management
- Flowchart Marketing Process. Flowchart Examples | Flowchart ...
- Correlation Between Product Sale And Marketing Graph
- Product Sale Flow
- Stage Marketing Solution
- Sales Process Flowchart. Flowchart Examples | Sales Process ...
- Flowchart Marketing Process. Flowchart Examples | Marketing Flow ...
- Marketing Porter
- Marketing And Sales Model Flowchart
- Process Flowchart | Sales Process Flowchart. Flowchart Examples ...
- Block diagram - Selling technology patent process | Sales Process ...
- Invoice lifecycle | Invoice lifecycle | Marketing and Sales ...