Flow Chart Symbols

Business Process Flowchart Symbols

"Project planning is part of project management, which relates to the use of schedules such as Gantt charts to plan and subsequently report progress within the project environment.
Initially, the project scope is defined and the appropriate methods for completing the project are determined. Following this step, the durations for the various tasks necessary to complete the work are listed and grouped into a work breakdown structure. Project planning is often used to organize different areas of a project, including project plans, work loads and the management of teams and individuals. The logical dependencies between tasks are defined using an activity network diagram that enables identification of the critical path. Float or slack time in the schedule can be calculated using project management software. Then the necessary resources can be estimated and costs for each activity can be allocated to each resource, giving the total project cost. At this stage, the project schedule may be optimized to achieve the appropriate balance between resource usage and project duration to comply with the project objectives. Once established and agreed, the project schedule becomes what is known as the baseline schedule. Progress will be measured against the baseline schedule throughout the life of the project. Analyzing progress compared to the baseline schedule is known as earned value management.
The inputs of the project planning phase include the project charter and the concept proposal. The outputs of the project planning phase include the project requirements, the project schedule, and the project management plan." [Project planning. Wikipedia]
The flow chart example "Project planning process" was created using the ConceptDraw PRO diagramming and vector drawing software extended with the Flowcharts solution from the area "What is a Diagram" of ConceptDraw Solution Park.
Flowchart - Project planning process

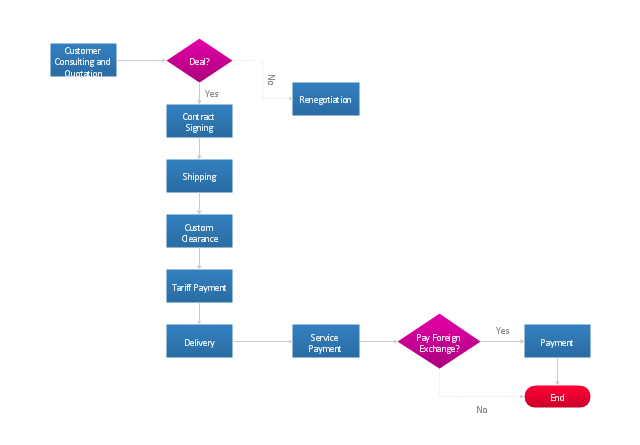
"An import is a good brought into a jurisdiction, especially across a national border, from an external source. The purchaser of the exotic good is called an importer. An import in the receiving country is an export from the sending country. Importation and exportation are the defining financial transactions of international trade.
In international trade, the importation and exportation of goods are limited by import quotas and mandates from the customs authority. The importing and exporting jurisdictions may impose a tariff (tax) on the goods. In addition, the importation and exportation of goods are subject to trade agreements between the importing and exporting jurisdictions." [Import. Wikipedia]
The flow chart example "Import process" was created using the ConceptDraw PRO diagramming and vector drawing software extended with the Flowcharts solution from the area "What is a Diagram" of ConceptDraw Solution Park.
Flowchart - Import process
"Product life cycle is a business analysis that attempts to identify a set of common stages in the life of commercial products. In other words the 'Product Life cycle' PLC is used to map the lifespan of the product such as the stages through which a product goes during its lifespan. ...
The stages of a product's life cycle... :
1. INTRODUCTION... 2. GROWTH... 3. MATURITY... 4. DECLINE...
The product life cycle is an important concept in marketing. It includes four stages that a product goes through from when it was first thought of until it is eliminated from the industry. Not all products reach this final stage. Some continue to grow and others rise and fall." [Product lifecycle. Wikipedia]
The flow chart example "Product life cycle process" was created using the ConceptDraw PRO diagramming and vector drawing software extended with the Flowcharts solution from the area "What is a Diagram" of ConceptDraw Solution Park.
Flowchart - Product life cycle process

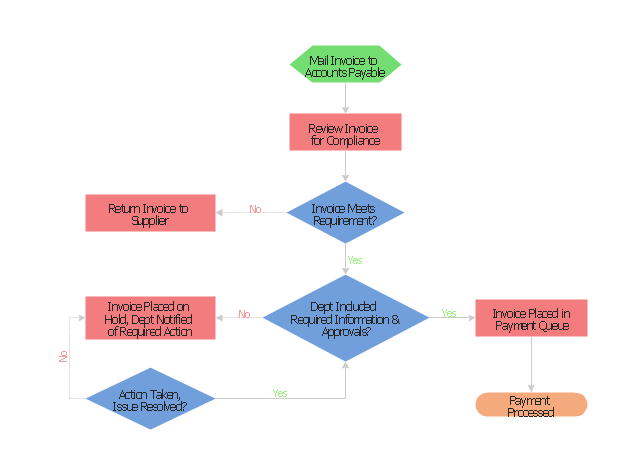
"An invoice, bill or tab is a commercial document issued by a seller to a buyer, relating to a sale transaction and indicating the products, quantities, and agreed prices for products or services the seller has provided the buyer.
Payment terms are usually stated on the invoice. These may specify that the buyer has a maximum number of days in which to pay, and is sometimes offered a discount if paid before the due date. The buyer could have already paid for the products or services listed on the invoice.
In the rental industry, an invoice must include a specific reference to the duration of the time being billed, so in addition to quantity, price and discount the invoicing amount is also based on duration. Generally each line of a rental invoice will refer to the actual hours, days, weeks, months, etc., being billed.
From the point of view of a seller, an invoice is a sales invoice. From the point of view of a buyer, an invoice is a purchase invoice. The document indicates the buyer and seller, but the term invoice indicates money is owed or owing. ...
Payment of invoices.
Organizations purchasing goods and services usually have a process in place for approving payment of invoices based on an employee's confirmation that the goods or services have been received.
Typically, when paying an invoice, a remittance advice will be sent to the supplier to inform them their invoice has been paid." [Invoice. Wikipedia]
The flow chart example "Invoice payment process" was created using the ConceptDraw PRO diagramming and vector drawing software extended with the Flowcharts solution from the area "What is a Diagram" of ConceptDraw Solution Park.
Flowchart - Invoice payment process
This accounting flowchart example was created on the base of the figure illustrating webpage "CHAPTER 4. CONDUCTING AN ADMINISTRATIVE REVIEW" from the website of the Federal Highway Administration (FHWA) of the United States Department of Transportation. [fhwa.dot.gov/ legsregs/ directives/ orders/ toolkita2.htm]
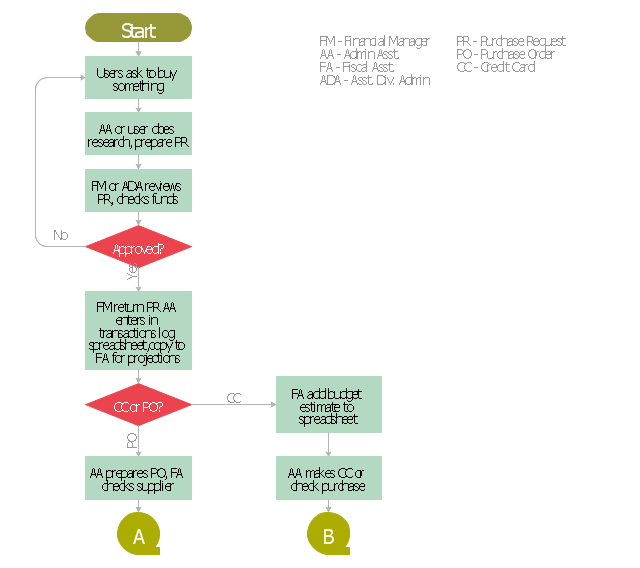
"Business process mapping refers to activities involved in defining what a business entity does, who is responsible, to what standard a business process should be completed, and how the success of a business process can be determined.
The main purpose behind business process mapping is to assist organizations in becoming more efficient. A clear and detailed business process map or diagram allows outside firms to come in and look at whether or not improvements can be made to the current process.
Business process mapping takes a specific objective and helps to measure and compare that objective alongside the entire organization's objectives to make sure that all processes are aligned with the company's values and capabilities." [Business process mapping. Wikipedia]
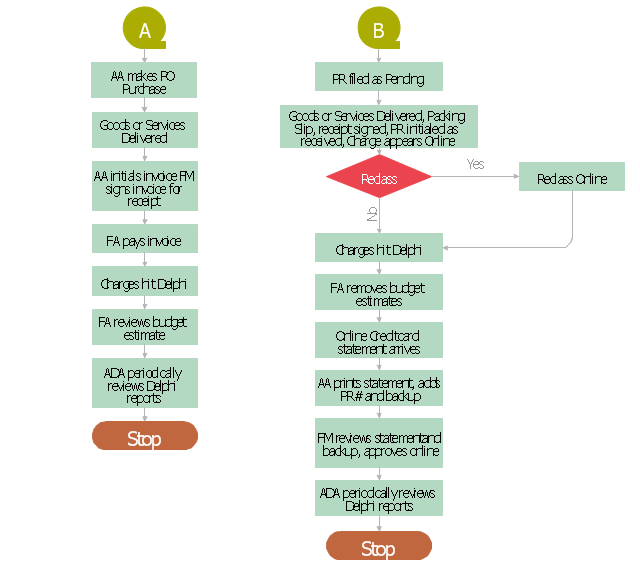
The business process map of procurement process example "Procurement process mapping" was created using the ConceptDraw PRO software extended with the Accounting Flowcharts solution from the Finance and Accounting area of ConceptDraw Solution Park.
"Business process mapping refers to activities involved in defining what a business entity does, who is responsible, to what standard a business process should be completed, and how the success of a business process can be determined.
The main purpose behind business process mapping is to assist organizations in becoming more efficient. A clear and detailed business process map or diagram allows outside firms to come in and look at whether or not improvements can be made to the current process.
Business process mapping takes a specific objective and helps to measure and compare that objective alongside the entire organization's objectives to make sure that all processes are aligned with the company's values and capabilities." [Business process mapping. Wikipedia]
The business process map of procurement process example "Procurement process mapping" was created using the ConceptDraw PRO software extended with the Accounting Flowcharts solution from the Finance and Accounting area of ConceptDraw Solution Park.
Procurement Process Mapping
Procurement Mapping Process A, B
This audit flowchart sample was created on the base of the figure from the website of The California Department of Industrial Relations (DIR).
"Audit Process.
There are many steps in the audit process and during a number of these steps there is substantial opportunity to communicate with the audit staff to ask questions and participate in the audit process. ... a flow chart providing a visual picture of the sequence of events that occur in the audit process." [dir.ca.gov/ osip/ AuditUnit/ AuditProcess.html]
The flowchart example "Audit process" was created using the ConceptDraw PRO diagramming and vector drawing software extended with the Audit Flowcharts solution from the Finance and Accounting area of ConceptDraw Solution Park.
www.conceptdraw.com/ solution-park/ finance-audit-flowcharts
Audit flowchart

"The general definition of an audit is a planned and documented activity performed by qualified personnel to determine by investigation, examination, or evaluation of objective evidence, the adequacy and compliance with established procedures, or applicable documents, and the effectiveness of implementation. The term may refer to audits in accounting, internal controls, quality management, project management, water management, and energy conservation.
Auditing is defined as a systematic and independent examination of data, statements, records, operations and performances (financial or otherwise) of an enterprise for a stated purpose. In any auditing the auditor perceives and recognizes the propositions before him for examination, collects evidence, evaluates the same and on this basis formulates his judgment which is communicated through his audit report. The purpose is then to give an opinion on the adequacy of controls (financial and otherwise) within an environment they audit, to evaluate and improve the effectiveness of risk management, control, and governance processes." [Audit. Wikipedia]
The audit flowchart example "Audit process flowchart" was created using the ConceptDraw PRO diagramming and vector drawing software extended with the Audit Flowcharts solution from the Finance and Accounting area of ConceptDraw Solution Park.
Audit Process Flowchart
.png--diagram-flowchart-example.png)
Section 1
.png--diagram-flowchart-example.png)
Section 2
.png--diagram-flowchart-example.png)
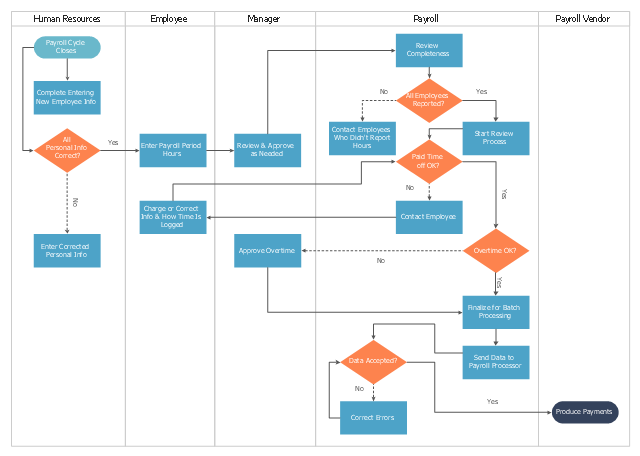
This cross-functional flowchart sample represents the payroll process mapping.
"Business process mapping refers to activities involved in defining what a business entity does, who is responsible, to what standard a business process should be completed, and how the success of a business process can be determined.
The main purpose behind business process mapping is to assist organizations in becoming more efficient. A clear and detailed business process map or diagram allows outside firms to come in and look at whether or not improvements can be made to the current process.
Business process mapping takes a specific objective and helps to measure and compare that objective alongside the entire organization's objectives to make sure that all processes are aligned with the company's values and capabilities.
ISO 9001 requires a business entity to follow a process approach when managing its business, and to this end creating business process maps will assist. The entity can then work towards ensuring its processes are effective (the right process is followed the first time), and efficient (continually improved to ensure processes use the smallest amount of resources)." [Business process mapping. Wikipedia]
The business process map example "Swim lane diagram - Payroll process mapping" was drawn using the ConceptDraw PRO diagramming and vector drawing software extended with the Cross-Functional Flowcharts solution from the Business Processes area of ConceptDraw Solution Park.
Cross-functional flowchart
- Terminator Connectors Processes Decision Box Symbol In Flowchart
- Software for Flowchart Diagrams | Payroll process - Swim lane ...
- Draw Terminator Sequence Operation Process
- Audit process flowchart (multipage) | How to Create Flowchart Using ...
- Drawing Of Flowchart System For Terminator Connector And Decision
- Using Predefined Process In Flowchart
- Basic Flowchart Symbols and Meaning | Terminator Timeline Chart
- Process Flow Chart Symbols | Pros And Cons Of Terminator Symbol
- HR management process - Flowchart | How to Create a HR Process ...
- Basic Flowchart Symbols and Meaning | Business Process ...