This site uses cookies. By continuing to browse the ConceptDraw site you are agreeing to our Use of Site Cookies.
HelpDesk

How to Make Different Backgrounds Within a Multipage Drawing

ConceptDraw DIAGRAM documents can have multiple background pages. You can set a background for each page in your multiple pages. Read here on how to add different backgrounds into a single ConceptDraw DIAGRAM document.
HelpDesk

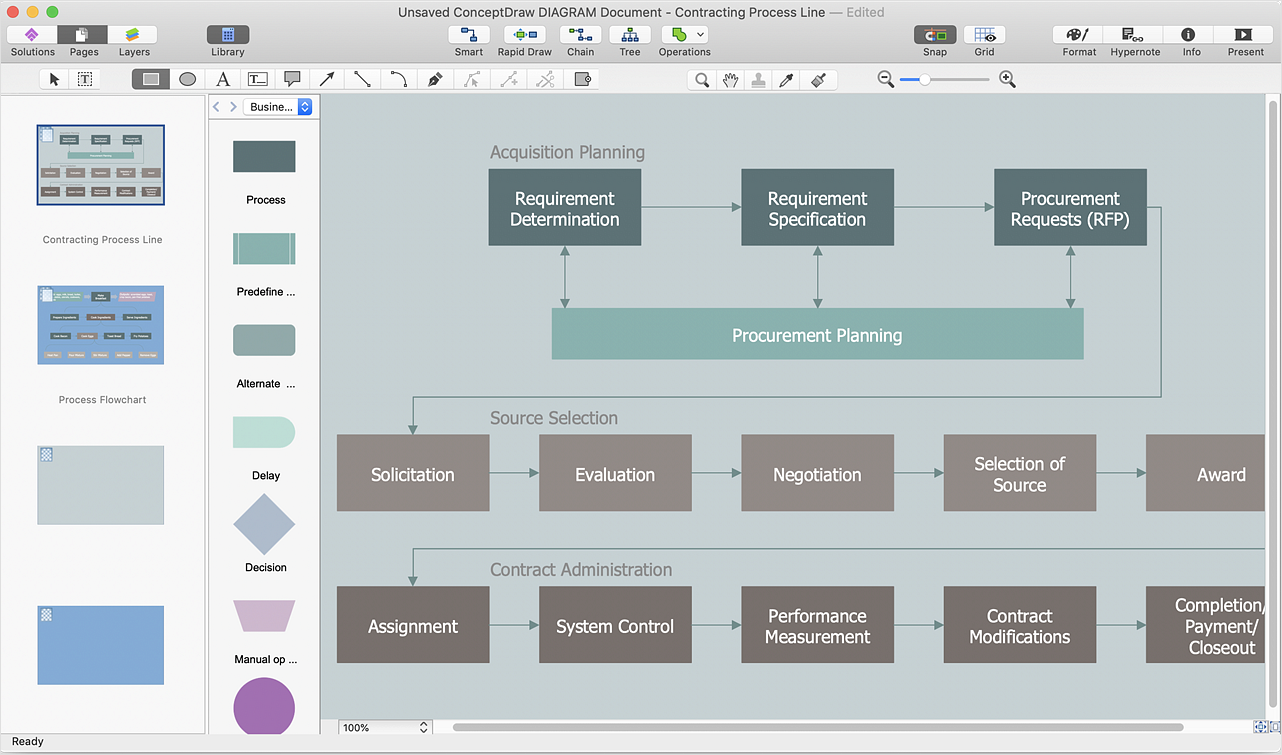
How to Add a Cross-Functional Flowchart to a PowerPoint Presentation

Using a Cross-Functional flowchart is a clear way of showing how business processes get shared or transferred between different teams and departments. ConceptDraw DIAGRAM allows you to make an MS PowerPoint Presentation from your flowcharts in a few simple steps.
HelpDesk

How to Make Business and Financial Infographics

The Infographics take an important place in the representation of information related to business or finances. Infographics can be helpful when presenting business concepts and strategies. Not to mention the fact that it is difficult to imagine training materials on business and finance without illustrative infographics. The Business and Finance solution is an add-on to ConceptDraw DIAGRAM business diagramming software. It designed to assist in designing business and finance related illustrations for infographics, presentations, reports, websites, etc.
HelpDesk

How to Add a Circle-spoke Diagram to PowerPoint

ConceptDraw DIAGRAM can be used as a tool for creating circle spoke diagrams along with other marketing diagrams. ConceptDraw DIAGRAM allows you to make an MS PowerPoint Presentation from your marketing diagrams in a few simple steps.
HelpDesk

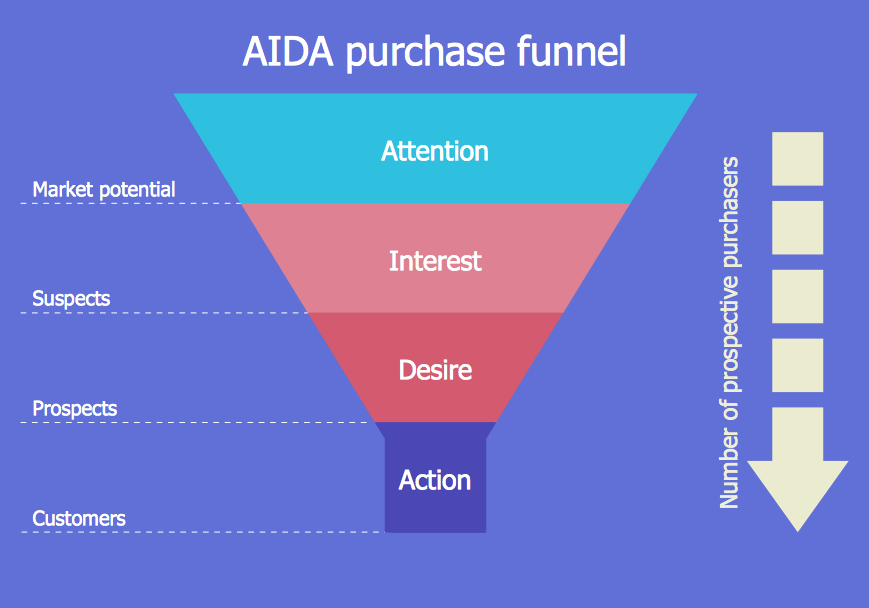
How to Create a Funnel Diagram

Marketing diagrams created in ConceptDraw DIAGRAM are a great tool to communicate marketing messages and simplify visualization of large amounts of data. The Marketing and Sales funnel is useful for monitoring the progress and success of advertising and marketing campaigns, for determining the number of customers that move to the next stage or disappear at each stage, for calculating the company's potential performance by stages, for tracking performance indicators for identifying the bottlenecks in the process and for large range of other tasks.
HelpDesk

How to Add a Bubble Diagram to PowerPoint Presentation

Bubble diagrams can be used to compare concepts and identify areas of similarity and difference. ConceptDraw DIAGRAM allows you to make an MS PowerPoint Presentation from your charts in a few simple steps. A bubble diagram is a chart that represents information visually in the form of a series of bubbles. Bubble charts are often used in marketing and management during the early stages of product development to visualize ideas and concepts by organizing them in a hierarchy. The ability to create this form of a diagram is contained within the Bubble Diagrams solution. A PowerPoint presentation of bubble diagrams can be used to demonstrate and identify areas of similarity and difference of featured business ideas and concepts.
HelpDesk

How To Add a Computer Network Diagram to a PowerPoint Presentation

The PowerPoint presentation of the computer network can be very informative. ConceptDraw DIAGRAM allows you to easily create computer network diagrams and then make a PowerPoint Presentation from your network diagrams in a single click.
HelpDesk

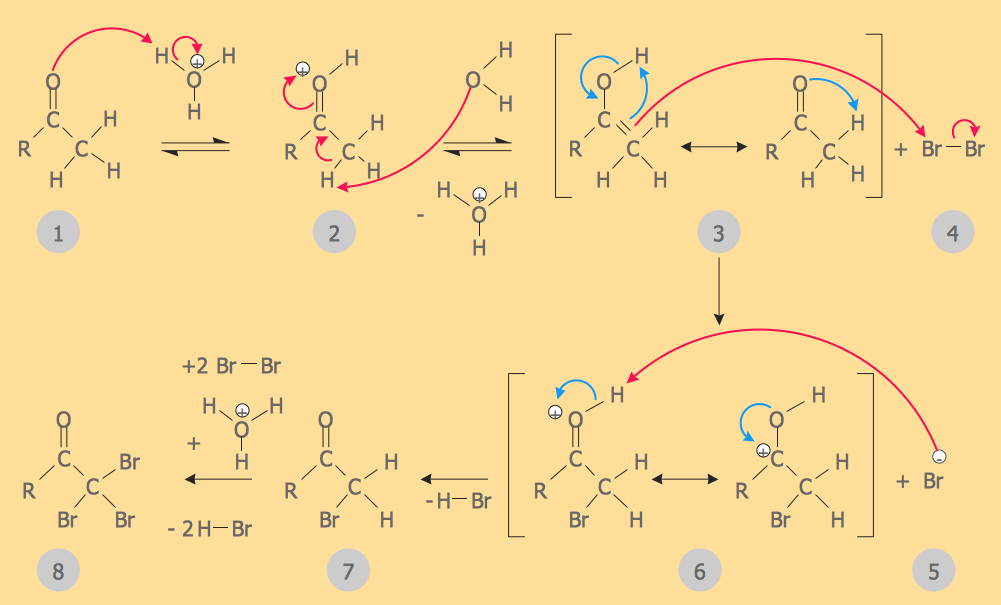
How to Draw Chemistry Structures

Making chemistry drawings for science and education purposes involves many different elements that can be managed using ConceptDraw DIAGRAM. ConceptDraw Chemistry solution can be used as a tool for creating chemical schemes and diagrams of chemical lab set-ups and labware, formulas, reaction schemes, and molecular structures. With ConceptDraw DIAGRAM you can easily create and communicate chemistry drawings of any complexity.
HelpDesk

How to Create a Cloud Computing Diagram

Cloud computing is a model of remote access to shared computing resources that are physically distributed in many remote devices. Cloud Computing is a technology that allows using the Internet to place computing resources and the provision of such services to customers. Using cloud computing means assigning responsibilities on applications and data storage service among special systems, which have a very high level of reliability and unlimited resources. The result is reducing the cost of service and providing users with ready-to-use service.
ConceptDraw's Cloud Computing Diagrams solution allows you to visualize cloud computing models of any configuration and complexity.
HelpDesk

How to Create PowerPoint® Text Slides from Mind Maps

ConceptDraw MINDMAP allows you to create a traditional PowerPoint Presentation from your mind maps. Here is an instruction on how to create PowerPoint slides from a mind map.