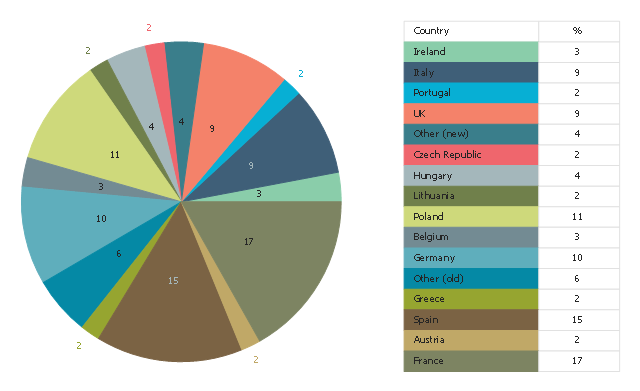
This pie chart sample shows the percentage of EU farm land by country. It was designed on the base of the Wikimedia Commons file: EUFarm-eng.svg. [commons.wikimedia.org/ wiki/ File:EUFarm-eng.svg]
"The agricultural sector is supported by subsidies from the European Union in the form of the Common Agricultural Policy (CAP). In 2013 this represented approximately €45billion (less than 33% of the overall budget of €148billion) of the EU's total spending. It was used originally to guarantee a minimum price for farmers in the EU. This is criticised as a form of protectionism, inhibiting trade, and damaging developing countries; one of the most vocal opponents is the UK, the second largest economy within the bloc, which has repeatedly refused to give up the annual UK rebate unless the CAP undergoes significant reform; France, the biggest beneficiary of the CAP and the bloc's third largest economy, is its most vocal proponent." [Economy of the European Union. Wikipedia]
The pie chart example "Percentage of EU farm land by country" was created using the ConceptDraw PRO diagramming and vector drawing software extended with the Pie Charts solutiton of the Graphs and Charts area in ConceptDraw Solution Park.
Pie chart
 Marketing Diagrams
Marketing Diagrams solution extends ConceptDraw DIAGRAM diagramming software with abundance of samples, templates and vector design elements intended for easy graphical visualization and drawing different types of Marketing diagrams and graphs, including Branding Strategies Diagram, Five Forces Model Diagram, Decision Tree Diagram, Puzzle Diagram, Step Diagram, Process Chart, Strategy Map, Funnel Diagram, Value Chain Diagram, Ladder of Customer Loyalty Diagram, Leaky Bucket Diagram, Promotional Mix Diagram, Service-Goods Continuum Diagram, Six Markets Model Diagram, Sources of Customer Satisfaction Diagram, etc. Analyze effectively the marketing activity of your company and apply the optimal marketing methods with ConceptDraw DIAGRAM software.
Bar Diagrams for Problem Solving. Create economics and financial bar charts with Bar Graphs Solution

 Area Charts
Area Charts are used to display the cumulative totals over time using numbers or percentages; or to show trends over time among related attributes. The Area Chart is effective when comparing two or more quantities. Each series of data is typically represented with a different color, the use of color transparency in an object’s transparency shows overlapped areas and smaller areas hidden behind larger areas.
 Flowcharts
The Flowcharts solution for ConceptDraw DIAGRAM is a comprehensive set of examples and samples in several varied color themes for professionals that need to represent graphically a process. Solution value is added by the basic flow chart template and shapes' libraries of flowchart notation. ConceptDraw DIAGRAM flow chart creator lets one depict the processes of any complexity and length, as well as design the Flowchart either vertically or horizontally.
 Floor Plans
Construction, repair and remodeling of the home, flat, office, or any other building or premise begins with the development of detailed building plan and floor plans. Correct and quick visualization of the building ideas is important for further construction of any building.
 Biomedicine
Biomedicine solution extends ConceptDraw DIAGRAM ector diagramming software with abundance of samples and libraries of vector biomedical icons, pictograms of biomedical sciences and biomedical technologies, the main purpose of which is to help biomedical doctors, biomedical researchers, scientific professionals, professors in biomedical science, technicians, lectors, students to describe visually and to illustrate new achievements and new technologies in biomedical science, results of experiments and tests at this field, to depict the history of biomedicine development, the stages and progress at this field, to plan future biomedicine technologies and to describe those that are now in development or on the stage of testing the biomedical technology by biomedical specialists, to design colorful and professionally looking illustrations, diagrams, presentation slides and infographics in fields of biomedicine, personalized medicine, regenerative medicine, molecular medicine, evidence-based medicine, reconstructive biomedicine, and preventive health care.
Flow chart Example. Warehouse Flowchart


- Example Of Pie Diagram Related To Agriculture India
- Pie Chart Of Agriculture Practices In India
- Indian Agriculture Sector Pie Chart
- Area Charts | Pie Charts Of Agriculture In India
- Pie Chart Production Of Crops
- Pie Charts | Pie Chart Of Indian Farming
- Area Charts | Cross Functional Flowchart Examples | Draw The ...
- Area Charts | Pie Chart Realted To Agriculture With Solve Exmpl
- Agriculture Related Pie Chart
- Pie Graph Example In Agriculture