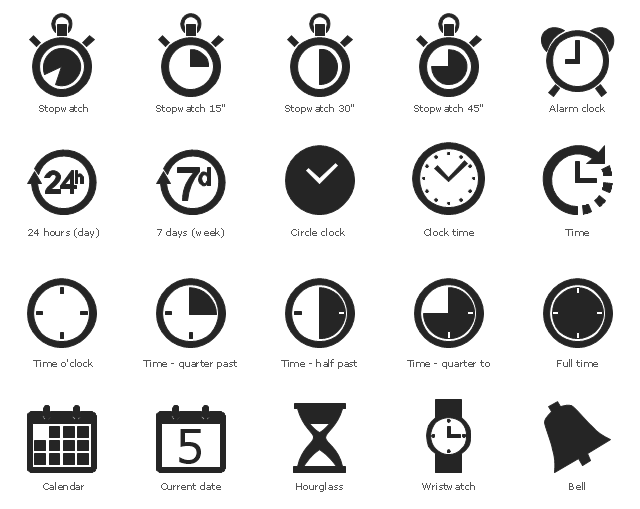
The vector stencils library "Time and clock pictograms" contains 20 time pictograms: clocks, calendars, day, week, bell, alarm clock, hourglass, wristwatch, and time intervals symbols.
Use it to create temporal infographic, illustrations and diagrams.
The example "Time and clock pictograms - Vector stencils library" was created using the ConceptDraw PRO diagramming and vector drawing software extended with the Pictorial infographics solution from the area "What is infographics" in ConceptDraw Solution Park.
Time
Stopwatch

Stopwatch 15"
Stopwatch 30"
Stopwatch 45"
24 h
7 d
Circle clock

Clock time
Time o'clock
Time - quarter past
Time - half past
Time - quarter to

Full time

Calendar

Current date

Hourglass

Wristwatch
Alarm clock

Bell

The vector stencils library "Education pictograms" contains 128 education pictograms. Use this flat icon set to design your educational infogram in ConceptDraw PRO diagramming and vector drawing software.
The vector stencils library "Education pictograms" is included in the Education Infographics solution from the Business Infographics area of ConceptDraw Solution Park.
The vector stencils library "Education pictograms" is included in the Education Infographics solution from the Business Infographics area of ConceptDraw Solution Park.
ABC
Apple
Artist oil colors

Artists paint palette
Atom

Baseball
Basketball

Beaker

Bell

Bicycle

Book - open

Books

Brushes
Bunsen burner

Calculator
Calendar

CD

Cell model

Chemical flask

Cloud

Colored paper
Colored pencils
Compass
Compasses

Dinosaur skeleton

Diploma

DNA double helix

Drop

Dumbbells

Earth

Earth's internal structure

Easel
Email

Eraser
Exercise book
Felt tip pens
Folders

Football

Funnel

Gears

Globe

Gouache

Graduation cap

Grand piano

Grand piano - clipart
Green blackboard

Hourglass

Laptop

Laptop mouse

Light bulb

Magnet

Magnifier

Marker - black

Marker - blue

Marker - green

Marker - red

Marker - white

Marker - yellow

Medal with ribbon
Metronome

Microscope

Moon

Music notes
Notebook

Notepad

Paper clips

Paper sheet

Paper sheet - grid
Paper sheet - lined
Paper stickers

Parthenon

Pen

Pen - fountain

Pencil

Periodic table
Protractor
Push pins

Robot

Round bottom flask

Rugby ball
Ruler
Scales
School backpack

School bus

School satchel

Schoolboy - african

Schoolboy - asian

Schoolboy - caucasian

Schoolboy - indian

Schoolgirl - african

Schoolgirl - asian

Schoolgirl - caucasian

Schoolgirl - indian

Scissors and a bottle of glue
Scroll

Snowflake

Sport cup

Star

Stickers
Stopwatch

Sun

Tablet computer

Teacher with a pointer

Teacher - african

Teacher - asian

Teacher - caucasian

Teacher - indian

Teacher - woman, african

Teacher - woman, asian

Teacher - woman, caucasian

Teacher - woman, indian

Telescope

Test tube

Thermometer
To-Do list

Tree leaf - acacia

Tree leaf - birch

Tree leaf - chestnut

Tree leaf - maple

Tree leaf - oak

Tree leaf - walnut

Triangle ruler
Volleyball

Violin
Violin - clipart
Wall clock
Watercolor set
World map

The vector stencils library "Time and clock pictograms" contains 20 time pictograms: clocks, calendars, day, week, bell, alarm clock, hourglass, wristwatch, and time intervals symbols.
Use it to create temporal infographic, illustrations and diagrams.
The pictograms example "Design elements - Time and clock pictograms" was created using the ConceptDraw PRO diagramming and vector drawing software extended with the Pictorial Infographic solution from the area "What is infographics" in ConceptDraw Solution Park.
Temporal pictograms
The vector stencils library "Education pictograms" contains 128 education pictograms. Use this flat icon set to design your educational infogram in ConceptDraw PRO diagramming and vector drawing software.
The vector stencils library "Education pictograms" is included in the Education Infographics solution from the Business Infographics area of ConceptDraw Solution Park.
The vector stencils library "Education pictograms" is included in the Education Infographics solution from the Business Infographics area of ConceptDraw Solution Park.
ABC
Apple
Artist oil colors
Artists paint palette
Atom
Baseball
Basketball
Beaker
Bell
Bicycle
Book - open
Books
Brushes
Bunsen burner
Calculator
Calendar
CD
Cell model
Chemical flask
Cloud
Colored paper
Colored pencils
Compass
Compasses
Dinosaur skeleton
Diploma
DNA double helix
Drop
Dumbbells
Earth
Earth's internal structure
Easel
Email
Eraser
Exercise book
Felt tip pens
Folders
Football
Funnel
Gears
Globe
Gouache
Graduation cap
Grand piano
Grand piano - clipart
Green blackboard
Hourglass
Laptop
Laptop mouse
Light bulb
Magnet
Magnifier
Marker - black
Marker - blue
Marker - green
Marker - red
Marker - white
Marker - yellow
Medal with ribbon
Metronome
Microscope
Moon
Music notes
Notebook
Notepad
Paper clips
Paper sheet
Paper sheet - grid
Paper sheet - lined
Paper stickers
Parthenon
Pen
Pen - fountain
Pencil
Periodic table
Protractor
Push pins
Robot
Round bottom flask
Rugby ball
Ruler
Scales
School backpack
School bus
School satchel
Schoolboy - african
Schoolboy - asian
Schoolboy - caucasian
Schoolboy - indian
Schoolgirl - african
Schoolgirl - asian
Schoolgirl - caucasian
Schoolgirl - indian
Scissors and a bottle of glue
Scroll
Snowflake
Sport cup
Star
Stickers
Stopwatch
Sun
Tablet computer
Teacher with a pointer
Teacher - african
Teacher - asian
Teacher - caucasian
Teacher - indian
Teacher - woman, african
Teacher - woman, asian
Teacher - woman, caucasian
Teacher - woman, indian
Telescope
Test tube
Thermometer
To-Do list
Tree leaf - acacia
Tree leaf - birch
Tree leaf - chestnut
Tree leaf - maple
Tree leaf - oak
Tree leaf - walnut
Triangle ruler
Volleyball
Violin
Violin - clipart
Wall clock
Watercolor set
World map
Design Pictorial Infographics. Design Infographics

Infographic Maker

The vector stencils library "HR symbols" contains 45 HR pictograms.
Use this icon set with HR symbols to draw your HR flowcharts, workflow diagrams, process charts and infographics with the ConceptDraw PRO diagramming and vector drawing software.
The HR pictograms library "HR symbols" is included in the HR Flowcharts solution from the Management area of ConceptDraw Solution Park.
Absence management

Absenteeism

Achievement

Attract

Authority and accountability

Business goals

Business success

Capital formation

Career

Career ladder

Communication

Compensation management

Conflict management

Conformance

Dress code

Education

Global HR

Headhunting

Hierarchical organization

Human capital

Human resource management

Incentive compensation management

Increase productivity

Job performance

Job satisfaction

Labor Unions

Leadership

Motivation and incentives

Organizational culture

Partnership

Performance management

Problem solving

Retention

Skill

Smart ideas

Staff turnover

Succession management

Talent acquisition

Time efficiency

Time management

Timekeeping
Winner

Workforce planning

Workplace culture

Workplace health and safety

ERD Symbols and Meanings


- Education pictograms - Vector stencils library | Hourglass Flat Icon Png
- Time and clock pictograms - Vector stencils library | ERD Symbols ...
- Education pictograms - Vector stencils library | Computers - Vector ...
- Time and clock pictograms - Vector stencils library
- Time and clock pictograms - Vector stencils library | Time and clock ...
- Basketball Court Dimensions | Graphic User Interface | Time and ...
- Time and clock pictograms - Vector stencils library | Design ...
- Time and clock pictograms - Vector stencils library | Calendars ...
- ERD Symbols and Meanings | Time and clock pictograms - Vector ...
- Time and clock pictograms - Vector stencils library | Piktogram Home
- Time and clock pictograms - Vector stencils library | Stopwatch ...
- Time and clock pictograms - Vector stencils library | Funny aquatic ...
- Time and clock pictograms - Vector stencils library | Android User ...
- Time - Design Elements | Time and clock pictograms - Vector ...
- How to Customize a Task's Duration | Time and clock pictograms ...
- Time and clock pictograms - Vector stencils library | How to ...
- Proposed Patient Appointment Procedure | Time and clock ...
- Time and clock pictograms - Vector stencils library | Time - Vector ...
- How To use House Electrical Plan Software | Time and clock ...
- Basketball Court Dimensions | Time and clock pictograms - Vector ...