This work flow chart sample was redesigned from the picture "Weather Forecast" from the article "Simulation Workflows".
[iaas.uni-stuttgart.de/ forschung/ projects/ simtech/ sim-workflows.php]
"(1) The weather is predicted for a particular geological area. Hence, the workflow is fed with a model of the geophysical environment of ground, air and water for a requested area.
(2) Over a specified period of time (e.g. 6 hours) several different variables are measured and observed. Ground stations, ships, airplanes, weather balloons, satellites and buoys measure the air pressure, air/ water temperature, wind velocity, air humidity, vertical temperature profiles, cloud velocity, rain fall, and more.
(3) This data needs to be collected from the different sources and stored for later access.
(4) The collected data is analyzed and transformed into a common format (e.g. Fahrenheit to Celsius scale). The normalized values are used to create the current state of the atmosphere.
(5) Then, a numerical weather forecast is made based on mathematical-physical models (e.g. GFS - Global Forecast System, UKMO - United Kingdom MOdel, GME - global model of Deutscher Wetterdienst). The environmental area needs to be discretized beforehand using grid cells. The physical parameters measured in Step 2 are exposed in 3D space as timely function. This leads to a system of partial differential equations reflecting the physical relations that is solved numerically.
(6) The results of the numerical models are complemented with a statistical interpretation (e.g. with MOS - Model-Output-Statistics). That means the forecast result of the numerical models is compared to statistical weather data. Known forecast failures are corrected.
(7) The numerical post-processing is done with DMO (Direct Model Output): the numerical results are interpolated for specific geological locations.
(8) Additionally, a statistical post-processing step removes failures of measuring devices (e.g. using KALMAN filters).
(9) The statistical interpretation and the numerical results are then observed and interpreted by meteorologists based on their subjective experiences.
(10) Finally, the weather forecast is visualized and presented to interested people." [iaas.uni-stuttgart.de/ forschung/ projects/ simtech/ sim-workflows.php]
The example "Workflow diagram - Weather forecast" was drawn using the ConceptDraw PRO diagramming and vector drawing software extended with the Workflow Diagrams solution from the Business Processes area of ConceptDraw Solution Park.
Work flow chart

This work flow chart sample was redesigned from the picture "Simulation for earthquake disaster assessment" from the article "Simulation Workflows".
[iaas.uni-stuttgart.de/ forschung/ projects/ simtech/ sim-workflows.php]
" This simulation was developed to have an in depth understanding of the destructions and the decisions to be made in various phases of crisis management (Source: Mahdi Hashemi and Ali A. Alesheikh (2010). "Developing an agent based simulation model for earthquakes in the context of SDI." GSDI 12 World Conference. 19 – 22 October 2010. Singapour). The simulation process contains following major steps:
(1) All spatial information including satellite images (before and after the earthquake) and topographic/ cadastral maps of the area are mosaicked and georeferenced. The parts of the city that contain various levels of destructions are selected. Three types of features namely buildings, roads and recreational areas are classified and extracted from the satellite images.
(2) The governing factors of destructions are identified; a mathematical model that integrates the factors is constructed.
(3) The simulation is constructed for various parameter values (different earthquake strength, time elapses, etc.)" [iaas.uni-stuttgart.de/ forschung/ projects/ simtech/ sim-workflows.php]
The example "Workflow diagram - Earthquake disaster assessment" was drawn using the ConceptDraw PRO diagramming and vector drawing software extended with the Workflow Diagrams solution from the Business Processes area of ConceptDraw Solution Park.
Work flow chart

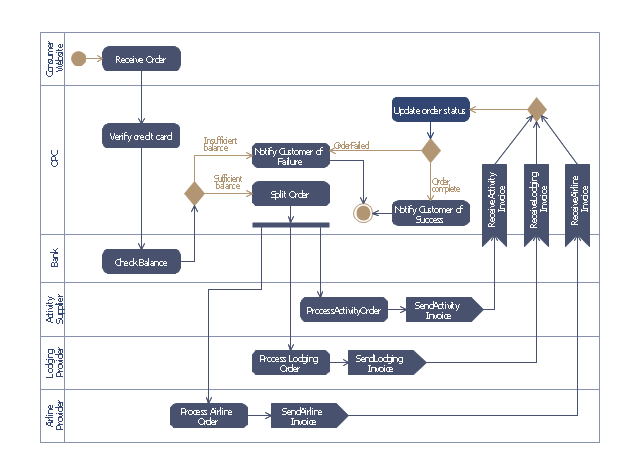
This purchase order processing UML activity diagram was created on the base of activity diagram from the software architecture documentation wiki of the Software Engineering Institute (SEI) of Carnegie Mellon University (CMU).
[wiki.sei.cmu.edu/ sad/ index.php/ Image:PurchaseOrderActivityDiagram.png]
"A purchase order (PO) is a commercial document and first official offer issued by a buyer to a seller, indicating types, quantities, and agreed prices for products or services. Acceptance of a purchase order by a seller forms a contract between the buyer and seller, so no contract exists until the purchase order is accepted. It is used to control the purchasing of products and services from external suppliers.
Creating a purchase order is typically the first step of the purchase to pay process in an ERP system." [Purchase order. Wikipedia]
This purchase order processing UML activity diagram example was created using the ConceptDraw PRO diagramming and vector drawing software extended with the ATM UML Diagrams solution from the Software Development area of ConceptDraw Solution Park.
UML activity diagram of purchase order processing
This circle-spoke diagram sample shows the social determinants of health. It was created on the base of the hub-and-spoke diagram from the Health Canada website. [hc-sc.gc.ca/ sr-sr/ pubs/ hpr-rpms/ bull/ 2005-climat/ 2005-climat-6-eng.php]
"Social determinants of health are the economic and social conditions – and their distribution among the population – that influence individual and group differences in health status. They are risk factors found in one's living and working conditions (such as the distribution of income, wealth, influence, and power), rather than individual factors (such as behavioural risk factors or genetics) that influence the risk for a disease, or vulnerability to disease or injury. According to some viewpoints, these distributions of social determinants are shaped by public policies that reflect the influence of prevailing political ideologies of those governing a jurisdiction. ...
In 2003, the World Health Organization (WHO) Europe suggested that the social determinants of health included:
(1) Social gradients (life expectancy is shorter and disease is more common further down the social ladder).
(2) Stress (including stress in the workplace).
(3) Early childhood development.
(4) Social exclusion.
(5) Unemployment.
(6) Social support networks.
(7) Addiction.
(8) Availability of healthy food.
(9) Availability of healthy transportation." [Social determinants of health. Wikipedia]
The hub-and-spoke diagram example "Social determinants of health" was created using the ConceptDraw PRO diagramming and vector drawing software extended with the Circle-Spoke Diagrams solution from the area "What is a Diagram" of ConceptDraw Solution Park.
Circle-spoke diagram

 Collaboration Area
The solutions from Collaboration area of ConceptDraw Solution Park extend ConceptDraw PRO and ConceptDraw MINDMAP software with features, samples, templates and vector stencils libraries for drawing diagrams and mindmaps useful for collaboration.
The vector stencils library "AWS SDKs" contains 13 Amazon Web Services SDK icons.
Use it to draw Amazon Web Services architecture diagrams.
The AWS icons example "Design elements - AWS SDKs" was created using the ConceptDraw PRO diagramming and vector drawing software extended with the AWS Architecture Diagrams solution from the Computer and Networks area of ConceptDraw Solution Park.
AWS architecture diagram icons
Design Element: Active Directory for Network Diagrams
")

 Universal Diagramming Area
This area collects solutions for drawing diagrams, charts, graphs, matrices, geographic and road maps for education, science, engineering, business.
This circular motion diagram sample was created on the base of the figure illustrating the article "Collaboration 2.0" from the HLWIKI International website. "Collaboration is an activity where individuals are motivated to work together in order to achieve certain mutually-desirable, articulated and achievable goals. In the digital age, collaboration 2.0 combines various aspects of web 2.0 and social media with the principles of collaboration. Some critical or typical features of collaboration 2.0 should include:
(1) synchronous collaboration via social calendaring, online meeting software and instant messaging tools,
(2) asynchronous collaboration made possible via shared workspaces and annotation capabilities.
A new form of collaboration is called collaborative information seeking which Wikipedia defines as "... a field of research that involves studying situations, motivations, and methods for people working in collaborative groups for information seeking projects, as well as building systems for supporting such activities. Such projects often involve information searching or information retrieval (IR), information gathering, and information sharing. Beyond that, CIS can extend to collaborative information synthesis and collaborative sense-making." " [hlwiki.slais.ubc.ca/ index.php/ Collaboration_ 2.0]
This file is available under a Creative Commons Attribution-NonCommercial-ShareAlike 2.5 Generic Licence. [creativecommons.org/ licenses/ by-nc-sa/ 2.5/ ]
The circular arrow diagram example "Collaboration life-cycle" was created using the ConceptDraw PRO diagramming and vector drawing software extended with the Target and Circular Diagrams solution from the Marketing area of ConceptDraw Solution Park.
www.conceptdraw.com/ solution-park/ marketing-target-and-circular-diagrams
Circular motion diagram
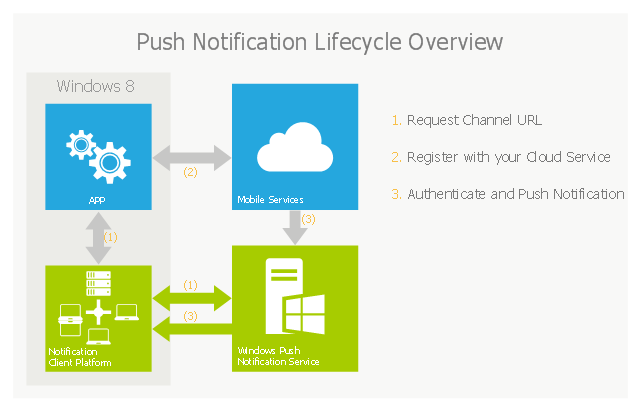
This example of cloud computing system architecture diagram was created on the base of picture in the post "Sending Windows 8 Push Notifications using Windows Azure Mobile Services" from the Nick Harris .NET blog.
"The goal of Windows Azure Mobile Services is to make it incredibly easy for developers to add a cloud backend to their client apps be it a Windows 8, Windows Phone, iOS or Android application. ... Mobile Services today provides:
- Structured Storage
- Server Logic ...
- Auth ...
- Push Notifications ...
- Common tenants of Windows Azure Services
- Scale ...
- Diagnostics ...
- Logging ...
What are Push Notifications?
The Windows Push Notification Services (WNS) enables you to send toast, tile, badge and raw notifications from the cloud to your Windows Store applications even when your app is not running. Push notifications are ideal for scenarios when you need to target a specific user with personalized content.
The following diagram depicts the general Lifecycle of a push notifications via the Windows Azure Notification Service (WNS). We’ll walk through the steps shortly but before doing so I thought it would be important to call out that as a developer implementing a push notification scenario all you need to do is implement those interactions in grey and the applications/ services in blue." [nickharris.net/ index.php/ 2012/ 10/ 04/ blog-series-sending-windows-8-push-notifications-using-windows-azure-mobile-services/ ]
The diagram example "Push Notification Lifecycle Overview" was created using ConceptDraw PRO diagramming and vector drawing software extended with the Azure Architecture solution from the Computer and Networks area of ConceptDraw Solution Park.
Cloud computing system architecture diagram
- AWS | AWS Architecture Diagrams | Architecture Diagrams | Php ...
- Example of DFD for Online Store (Data Flow Diagram ) DFD ...
- Php Network Diagram
- Example of DFD for Online Store (Data Flow Diagram ) DFD ...
- Earthquake disaster assessment - Workflow diagram | Workflow ...
- Example of DFD for Online Store (Data Flow Diagram ) DFD ...
- Conceptdraw.com: Mind Map Software, Drawing Tools | Project ...
- Workflow diagram - Weather forecast | How can you illustrate the ...
- Example of DFD for Online Store (Data Flow Diagram ) DFD ...
- Workflow diagram - Weather forecast
- Php Project Management Software
- Model validation - IDEF0 diagram | Earthquake disaster assessment ...
- Php Project Management
- Process Flowchart | Workflow diagram - Weather forecast | Basic ...
- Earthquake disaster assessment - Workflow diagram | Emergency ...
- Earthquake disaster assessment - Workflow diagram | Work Flow ...
- UML Diagram | Order processing center - UML sequence diagram ...
- Example of DFD for Online Store (Data Flow Diagram ) DFD ...
- Basic Flowchart Symbols and Meaning | Workflow diagram ...
- Workflow diagram - Weather forecast | Process Flowchart ...