HelpDesk
How to Make an Ansoff Matrix Template in ConceptDraw PRO

 25 Typical Orgcharts
The 25 Typical Orgcharts solution contains powerful organizational structure and organizational management drawing tools, a variety of professionally designed organization chart and matrix organization structure samples, 25 templates based on various orga
HelpDesk
What Information to be Displayed in the ConceptDraw PROJECT Gantt Chart View


This financila dashboard example was drawn on the base of the Enterprise dashboard from the Mecklenburg County Government website.
[charmeck.org/ mecklenburg/ county/ CountyManagersOffice/ OMB/ dashboards/ Pages/ Enterprise.aspx]
"In management information systems, a dashboard is "an easy to read, often single page, real-time user interface, showing a graphical presentation of the current status (snapshot) and historical trends of an organization’s key performance indicators to enable instantaneous and informed decisions to be made at a glance."
For example, a manufacturing dashboard may show key performance indicators related to productivity such as number of parts manufactured, or number of failed quality inspections per hour. Similarly, a human resources dashboard may show KPIs related to staff recruitment, retention and composition, for example number of open positions, or average days or cost per recruitment.
Types of dashboards.
Dashboard of Sustainability screen shot illustrating example dashboard layout.
Digital dashboards may be laid out to track the flows inherent in the business processes that they monitor. Graphically, users may see the high-level processes and then drill down into low level data. This level of detail is often buried deep within the corporate enterprise and otherwise unavailable to the senior executives.
Three main types of digital dashboard dominate the market today: stand alone software applications, web-browser based applications, and desktop applications also known as desktop widgets. The last are driven by a widget engine.
Specialized dashboards may track all corporate functions. Examples include human resources, recruiting, sales, operations, security, information technology, project management, customer relationship management and many more departmental dashboards.
Digital dashboard projects involve business units as the driver and the information technology department as the enabler. The success of digital dashboard projects often depends on the metrics that were chosen for monitoring. Key performance indicators, balanced scorecards, and sales performance figures are some of the content appropriate on business dashboards." [Dashboard (management information systems). Wikipedia]
The example "Enterprise dashboard" was created using the ConceptDraw PRO diagramming and vector drawing software extended with the Composition Dashboard solution from the area "What is a Dashboard" of ConceptDraw Solution Park.
Financial dashboard

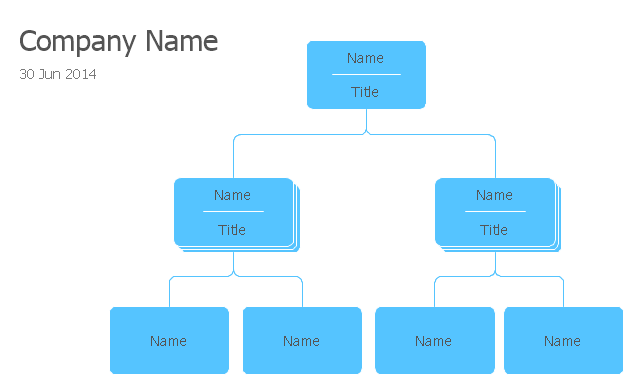
"The organization chart is a diagram showing graphically the relation of one official to another, or others, of a company. It is also used to show the relation of one department to another, or others, or of one function of an organization to another, or others. This chart is valuable in that it enables one to visualize a complete organization, by means of the picture it presents.
A company's organizational chart typically illustrates relations between people within an organization. Such relations might include managers to sub-workers, directors to managing directors, chief executive officer to various departments, and so forth. When an organization chart grows too large it can be split into smaller charts for separate departments within the organization." [Organizational chart. Wikipedia]
This organizational chart template for the ConceptDraw PRO diagramming and vector drawing software is included in the Organizational Charts solution from the Management area of ConceptDraw Solution Park.
Organizational chart template
- Matrix Organization Structure | 25 Typical Orgcharts | SWOT analysis ...
- How to Draw an Organization Chart | Organizational Structure ...
- How to Draw an Organization Chart | Draw Company Structure with ...
- Matrix Organization Structure | 25 Typical Orgcharts | SWOT analysis ...
- Matrix Organization Structure | How to Draw a Matrix Organizational ...
- Matrix Organization Structure | How to Draw a Matrix Organizational ...
- Matrix Organization Shown In A Circular Chart
- How to Draw a Matrix Organizational Chart with ConceptDraw PRO ...
- Matrix Organization Structure | 25 Typical Orgcharts | Matrix ...
- Companies Organisation Chart And Positions Of Accountant Doc
- Six Markets Model Chart Template | Marketing | Marketing and Sales ...
- Bubble Chart Template
- How to Draw a Matrix Organizational Chart with ConceptDraw PRO ...
- Excel Bubble Chart Template
- How to Draw an Organization Chart | ConceptDraw PRO ...
- Matrix Organization Structure | Marketing and Sales Organization ...
- Business Mamagement Flow Chart Position
- How to Draw an Organization Chart | ConceptDraw PRO ...
- How to Draw an Organization Chart | How to Draw a Bubble Chart ...
- Diagram Of Organisation Chart Of Standard Company