"Organizational behavior is a field of study that investigates the impact that individuals, groups and structures have on behavior within an organization for the purpose of applying such knowledge towards improving an organization's effectiveness. It is an interdisciplinary field that includes sociology, psychology, communication, and management; and it complements the academic studies of organizational theory (which is focused on organizational and intra-organizational topics) and human resource studies (which is more applied and business-oriented). It may also be referred to as organizational studies or organizational science." [Organizational behavior. Wikipedia]
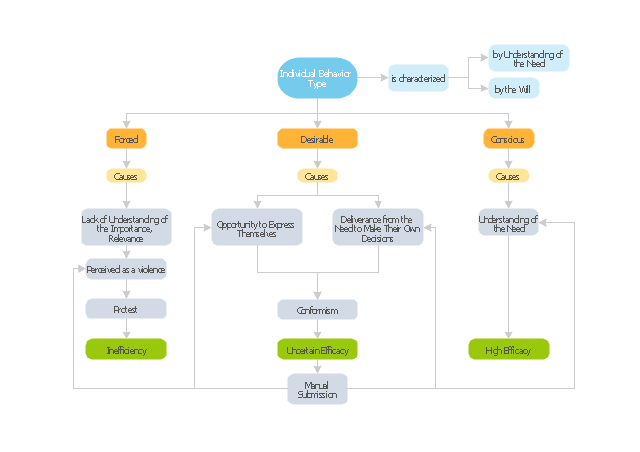
The block diagram example "Types of individual behavior in organization" was created using the ConceptDraw PRO diagramming and vector drawing software extended with the Block Diagrams solution from the area "What is a Diagram" of ConceptDraw Solution Park.
The block diagram example "Types of individual behavior in organization" was created using the ConceptDraw PRO diagramming and vector drawing software extended with the Block Diagrams solution from the area "What is a Diagram" of ConceptDraw Solution Park.
Block diagram
"At the base of the identity of an organisational is its organizational culture. A culture is comprised of the shared values, customs, traditions, rituals, behaviours and beliefs shared by a social group (national, ethnic, organizational, etc.). Cultures also share languages, or ways of speaking. From a communication perspective, cultures are made and remade through the words we use to describe our world. Culture represents a common set of values (“shared meanings”), shared by members of a population, a organization, a project/ programme purpose unit or a profession (e.g., engineers versus scientists). Culture change with the times but the speed at which the culture of different institutions change varies widely." [Development Cooperation Handbook/ The development aid organization/ Organizational Culture. Wikibooks]
This organizational culture triangle diagram example derived from Parker and Benson's model. It's for explaination of the Regatta: Adoption Method.
The pyramid diagram example "Organizational culture" was redesigned using the ConceptDraw PRO diagramming and vector drawing software from Wikimedia Commons file Organization_ Triangle.png. [commons.wikimedia.org/ wiki/ File:Organization_ Triangle.png]
This file is licensed under the Creative Commons Attribution-Share Alike 2.5 Generic license. [creativecommons.org/ licenses/ by-sa/ 2.5/ deed.en]
The triangular chart sample "Organizational culture" is included in the Pyramid Diagrams solution from the Marketing area of ConceptDraw Solution Park.
Pyramid diagram

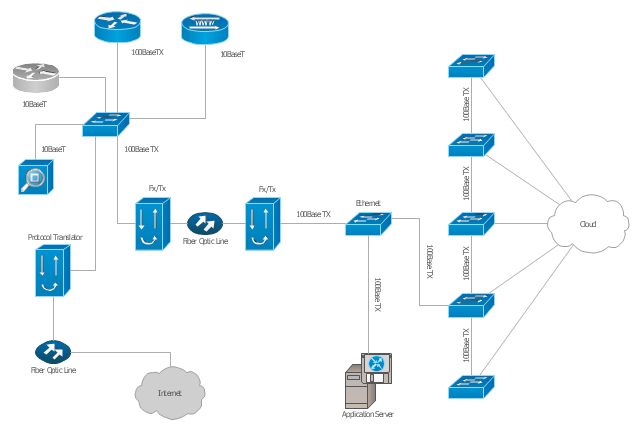
"A computer network diagram is a schematic depicting the nodes and connections amongst nodes in a computer network or, more generally, any telecommunications network. ...
Depending on whether the diagram is intended for formal or informal use, certain details may be lacking and must be determined from context. ...
At different scales diagrams may represent various levels of network granularity. At the LAN level, individual nodes may represent individual physical devices, such as hubs or file servers, while at the WAN level, individual nodes may represent entire cities. In addition, when the scope of a diagram crosses the common LAN/ MAN/ WAN boundaries, representative hypothetical devices may be depicted instead of showing all actually existing nodes." [Computer network diagram. Wikipedia]
The Cisco computer network diagram example "Network organization chart" was created using the ConceptDraw PRO diagramming and vector drawing software extended with the Cisco Network Diagrams solution from the Computer and Networks area of ConceptDraw Solution Park.
Cisco network diagram
HelpDesk
How to Create Organizational Chart Quickly

HelpDesk
How to Draw an Organizational Chart Using ConceptDraw PRO

 Organizational Charts
Organizational Charts solution extends ConceptDraw PRO software with samples, templates and library of vector stencils for drawing the org charts.
HelpDesk
Event-driven Process Chain (EPC) Diagram Software

- How to Draw an Organization Chart | Organizational Structure ...
- 5 level pyramid model diagram of information systems types ...
- How to Draw an Organization Chart | Orgchart | Organization Chart ...
- Organizational Chart Templates | UML composite structure diagram ...
- How to Create Organizational Chart Quickly | How to Draw an ...
- The Organizational Planning Process With Diagram
- Block diagram - Types of individual behavior in organization | Basic ...
- Organization chart - Foodbank | Examples of Flowcharts, Org Charts ...
- Block diagram - Types of individual behavior in organization ...
- How to Draw an Organization Chart | Pie Chart Examples and ...
- Diagram Of Types Of Organizational Structure
- Marketing Diagrams | Marketing Charts | Marketing Organization ...
- Marketing and Sales Organization chart . Organization chart Example
- Business Diagram Software | How to Draw an Organization Chart ...
- Organizational Structure | How to Draw an Organization Chart ...
- Pyramid Chart Examples | Pyramid Diagram | Organizational Charts ...
- How to Create Organizational Chart Quickly | Management | How to ...
- Active Directory Domain Services diagram | 25 Typical Orgcharts ...
- Structure Of Organization With Block Diagram
- Organizational Structure | Matrix Organization Structure | Business ...