HelpDesk
How to Create a Fault Tree Analysis Diagram (FTD) in ConceptDraw PRO

This PFD of jet fuel mercaptan oxidation treating was redrawn from Wikipedia file: ConvLPGMerox.png. [en.wikipedia.org/ wiki/ File:ConvKeroMerox.png]
This file is licensed under the Creative Commons Attribution-Share Alike 3.0 Unported icense. [creativecommons.org/ licenses/ by-sa/ 3.0/ deed.en]
"Merox is an acronym for mercaptan oxidation. It is a proprietary catalytic chemical process developed by UOP used in oil refineries and natural gas processing plants to remove mercaptans from LPG, propane, butanes, light naphthas, kerosene and jet fuel by converting them to liquid hydrocarbon disulfides.
The Merox process requires an alkaline environment which, in some of the process versions, is provided by an aqueous solution of sodium hydroxide (NaOH), a strong base, commonly referred to as caustic. In other versions of the process, the alkalinity is provided by ammonia, which is a weak base.
The catalyst in some versions of the process is a water-soluble liquid. In other versions, the catalyst is impregnated onto charcoal granules.
Processes within oil refineries or natural gas processing plants that remove mercaptans and/ or hydrogen sulfide (H2S) are commonly referred to as sweetening processes because they results in products which no longer have the sour, foul odors of mercaptans and hydrogen sulfide. The liquid hydrocarbon disulfides may remain in the sweetened products, they may be used as part of the refinery or natural gas processing plant fuel, or they may be processed further.
The Merox process is usually more economical than using a catalytic hydrodesulfurization process for much the same purpose." [en.wikipedia.org/ wiki/ Merox]
The process flow diagram (PFD) example "Jet fuel mercaptan oxidation treating" was drawn using the ConceptDraw PRO software extended with the Chemical and Process Engineering solution from the Chemical and Process Engineering area of ConceptDraw Solution Park.
Process flow diagram (PFD)
-jet-fuel-mercaptan-oxidation-treating---pfd.png--diagram-flowchart-example.png)
Electrical Symbols — Logic Gate Diagram

"A logic gate is an idealized or physical device implementing a Boolean function, that is, it performs a logical operation on one or more logical inputs, and produces a single logical output. Depending on the context, the term may refer to an ideal logic gate, one that has for instance zero rise time and unlimited fan-out, or it may refer to a non-ideal physical device...
Logic gates are primarily implemented using diodes or transistors acting as electronic switches, but can also be constructed using electromagnetic relays (relay logic), fluidic logic, pneumatic logic, optics, molecules, or even mechanical elements. With amplification, logic gates can be cascaded in the same way that Boolean functions can be composed, allowing the construction of a physical model of all of Boolean logic, and therefore, all of the algorithms and mathematics that can be described with Boolean logic.
Logic circuits include such devices as multiplexers, registers, arithmetic logic units (ALUs), and computer memory, all the way up through complete microprocessors, which may contain more than 100 million gates. In practice, the gates are made from field-effect transistors (FETs), particularly MOSFETs (metal–oxide–semiconductor field-effect transistors).
Compound logic gates AND-OR-Invert (AOI) and OR-AND-Invert (OAI) are often employed in circuit design because their construction using MOSFETs is simpler and more efficient than the sum of the individual gates.
In reversible logic, Toffoli gates are used." [Logic gate. Wikipedia]
The logic gate diagram template for the ConceptDraw PRO diagramming and vector drawing software is included in the Electrical Engineering solution from the Engineering area of ConceptDraw Solution Park.
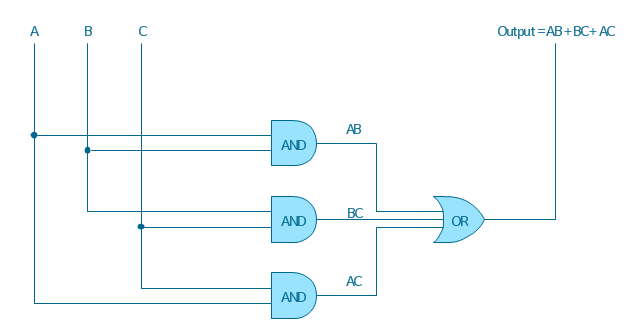
Logic gate diagram
The vector stencils library "Fault tree analysis diagrams" contains 12 symbols for drawing FTA diagrams in the ConceptDraw PRO diagramming and vector drawing software extended with the Fault Tree Analysis Diagrams solution from the Engineering area of ConceptDraw Solution Park.
www.conceptdraw.com/ solution-park/ engineering-fault-tree-analysis-diagrams
www.conceptdraw.com/ solution-park/ engineering-fault-tree-analysis-diagrams
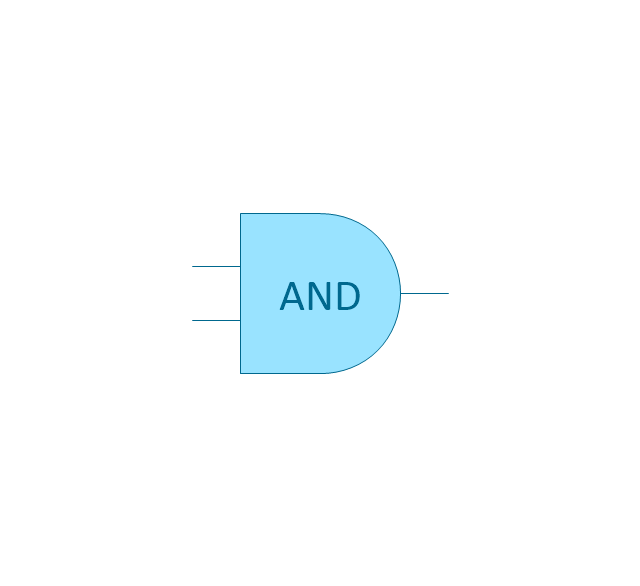
AND gate

Priority AND gate

OR gate

Inhibit gate

XOR gate

Event

Basic event

Undeveloped event

House event

Conditional event

Transfer symbol

Voting gate

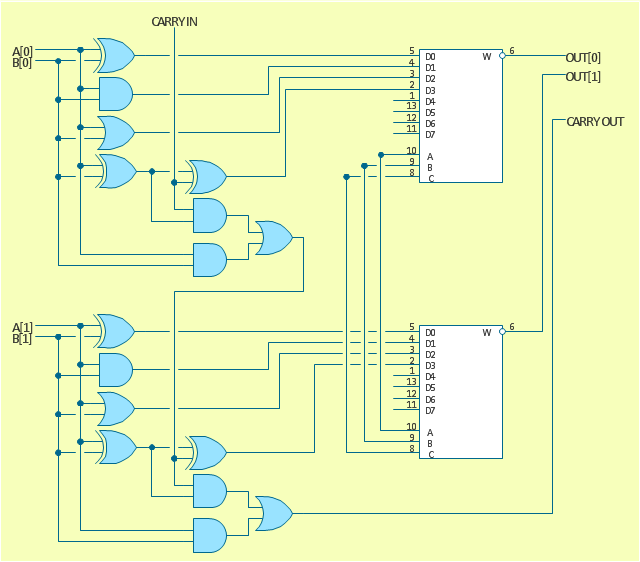
The logic gate diagram example "2-bit ALU" was redesigned from the Wikimedia Commons file: 2-bit ALU.svg.
[commons.wikimedia.org/ wiki/ File:2-bit_ ALU.svg]
This file is licensed under the Creative Commons Attribution-Share Alike 3.0 Unported license. [creativecommons.org/ licenses/ by-sa/ 3.0/ deed.en]
"In digital electronics, an arithmetic and logic unit (ALU) is a digital circuit that performs integer arithmetic and logical operations. The ALU is a fundamental building block of the central processing unit of a computer, and even the simplest microprocessors contain one for purposes such as maintaining timers. The processors found inside modern CPUs and graphics processing units (GPUs) accommodate very powerful and very complex ALUs; a single component may contain a number of ALUs. ...
Most of a processor's operations are performed by one or more ALUs. An ALU loads data from input registers. Then an external control unit tells the ALU what operation to perform on that data, and then the ALU stores its result into an output register. The control unit is responsible for moving the processed data between these registers, ALU and memory." [Arithmetic logic unit. Wikipedia]
The logic gate diagram example "2-bit ALU" was created using the ConceptDraw PRO diagramming and vector drawing software extended with the Electrical Engineering solution from the Engineering area of ConceptDraw Solution Park.
Logic gate diagram
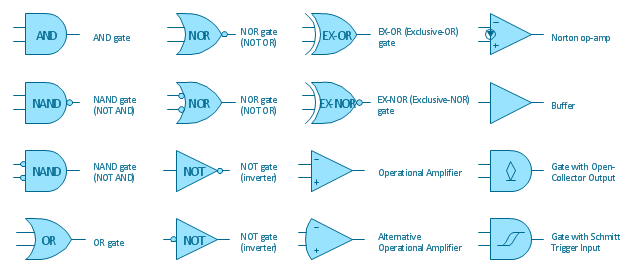
The vector stencils library "Logic gate diagram" contains 17 logical element symbols.
Use these shapes for drawing the logic gate diagrams in the ConceptDraw PRO diagramming and vector drawing software extended with the Electrical Engineering solution from the Engineering area of ConceptDraw Solution Park.
www.conceptdraw.com/ solution-park/ engineering-electrical
Use these shapes for drawing the logic gate diagrams in the ConceptDraw PRO diagramming and vector drawing software extended with the Electrical Engineering solution from the Engineering area of ConceptDraw Solution Park.
www.conceptdraw.com/ solution-park/ engineering-electrical
AND gate
OR gate

NOR gate (NOT OR)
-logic-gate-diagram---vector-stencils-library.png--diagram-flowchart-example.png)
NAND gate (NOT AND)
-logic-gate-diagram---vector-stencils-library.png--diagram-flowchart-example.png)
NOT gate (inverter)
-logic-gate-diagram---vector-stencils-library.png--diagram-flowchart-example.png)
EX-OR (Exclusive-OR) gate
-gate-logic-gate-diagram---vector-stencils-library.png--diagram-flowchart-example.png)
EX-NOR (Exclusive-NOR) gate
-gate-logic-gate-diagram---vector-stencils-library.png--diagram-flowchart-example.png)
Group

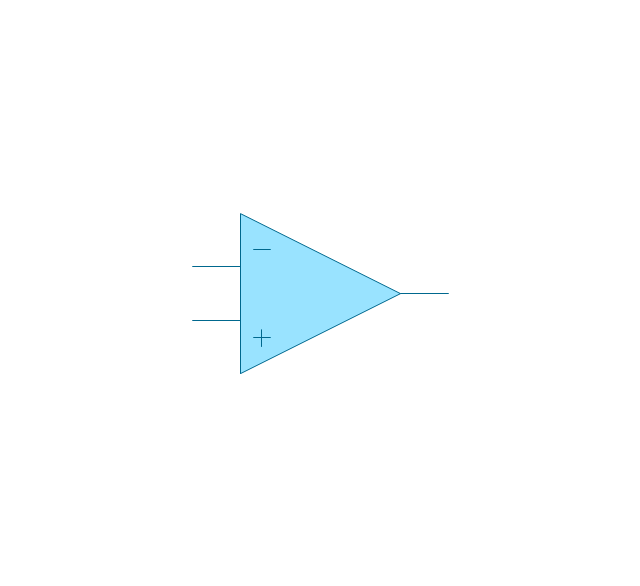
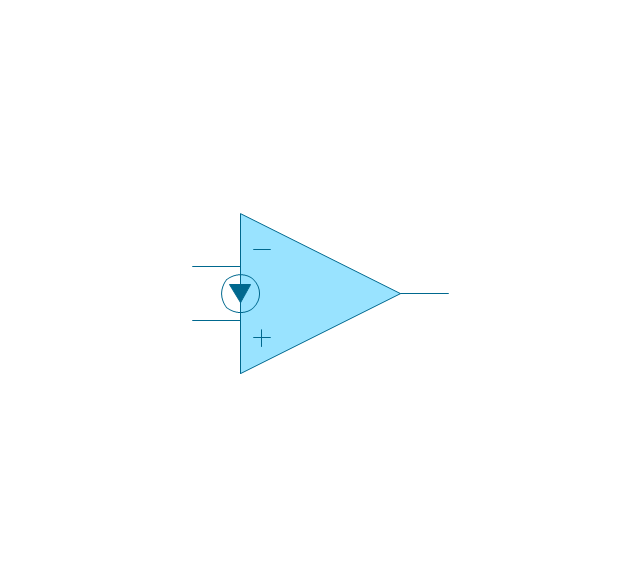
Operational Amplifier
Alternative Operational Amplifier
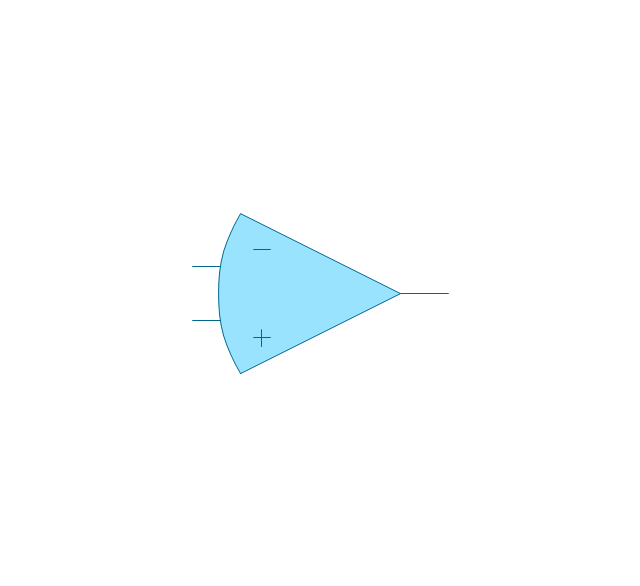
Norton op-amp
NOT gate (inverter)
-logic-gate-diagram---vector-stencils-library.png--diagram-flowchart-example.png)
NAND gate (NOT AND)
-logic-gate-diagram---vector-stencils-library.png--diagram-flowchart-example.png)
NOR gate (NOT OR)
-logic-gate-diagram---vector-stencils-library.png--diagram-flowchart-example.png)
Buffer

Gate with Open-Collector Output

Gate with Schmitt Trigger Input

The FTA diagram sample "Fault tree analysis - Insulin delivery system" was redesigned from the illustration of "CMSI 641: Introduction to Software Engineering. Design of Critical Systems. B.J. Johnson. 2005. Loyola Marymount University".
"Another way of assessing hazards is using fault tree analysis. In this process, each of the identified hazards is covered by a detailed analysis to find out what might cause it. Either inductive or deductive reasoning is applied. In the case of software hazards, the usual focus is to determine faults that will cause the system to fail to deliver a system service, such as a monitoring system. A "fault tree" is constructed to link all the possible situations together, to help identify the interrelationships of the failures, which modules may cause them, and what "trickle-down effects" there might be. Here is an example of a fault tree, as applied to the Insulin delivery system from Sommerville...
Note that this tree is only partially complete, since only the potential software faults are shown on the diagram. The potential failures involving hardware, such as low battery, blood monitor or sensor failure, patient over-exertion or inattention, or medical staff failure are noticeable by their absence.
The fault tree and safety specification processes are two ways of helping with system risk assessment tasks. Once the risks are identified, there are other assessments that need to take place. First, the likelihood of the risk occurrance must be assessed. This is often quantifiable, so numbers may be assigned based on things like MTBF, latency effects, and other known entities. There may be other non-quantifiable contributors to the risk likelihood, however, such that these must be assessed and estimated by experts in the domain. (Don't short-change this process when dealing with critical systems!) Finally, the risk assessment must include the severity of the risk, meaning an estimation of the cost to the project in the event the risk item actually does occur. "Cost to the project" means all associated costs, including schedule delays, human injury, damage to hardware, corruption of data, and so on."
[myweb.lmu.edu/ bjohnson/ cmsi641web/ week15-2.html]
The FTA diagram example "Fault tree analysis - Insulin delivery system" was created using the ConceptDraw PRO diagramming and vector drawing software extended with the Fault Tree Analysis Diagrams solution from the Engineering area of ConceptDraw Solution Park.
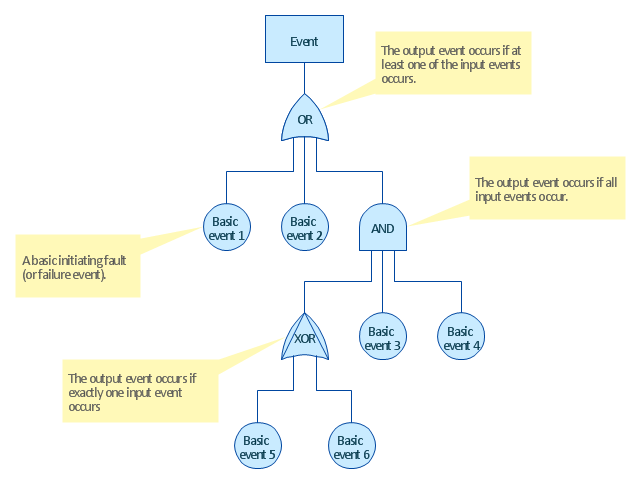
FTA diagram

"Fault tree analysis (FTA) ... can be used to:
(1) understand the logic leading to the top event / undesired state.
(2) show compliance with the (input) system safety / reliability requirements.
(3) prioritize the contributors leading to the top event - Creating the Critical Equipment/ Parts/ Events lists for different importance measures.
(4) monitor and control the safety performance of the complex system (e.g., is a particular aircraft safe to fly when fuel valve x malfunctions? For how long is it allowed to fly with the valve malfunction?).
(5) minimize and optimize resources.
(6) assist in designing a system. The FTA can be used as a design tool that helps to create (output / lower level) requirements.
(7) function as a diagnostic tool to identify and correct causes of the top event. It can help with the creation of diagnostic manuals / processes." [Fault tree analysis. Wikipedia]
The fault tree analysis diagram template for the ConceptDraw PRO diagramming and vector drawing software is included in the Fault Tree Analysis Diagrams solution from the Engineering area of ConceptDraw Solution Park.
FTA diagram template
Fault Tree Analysis Software

The FTA diagram sample "Fault tree analysis - Insulin delivery system" was redesigned from the illustration of "CMSI 641: Introduction to Software Engineering. Design of Critical Systems. B.J. Johnson. 2005. Loyola Marymount University".
"Another way of assessing hazards is using fault tree analysis. In this process, each of the identified hazards is covered by a detailed analysis to find out what might cause it. Either inductive or deductive reasoning is applied. In the case of software hazards, the usual focus is to determine faults that will cause the system to fail to deliver a system service, such as a monitoring system. A "fault tree" is constructed to link all the possible situations together, to help identify the interrelationships of the failures, which modules may cause them, and what "trickle-down effects" there might be. Here is an example of a fault tree, as applied to the Insulin delivery system from Sommerville...
Note that this tree is only partially complete, since only the potential software faults are shown on the diagram. The potential failures involving hardware, such as low battery, blood monitor or sensor failure, patient over-exertion or inattention, or medical staff failure are noticeable by their absence.
The fault tree and safety specification processes are two ways of helping with system risk assessment tasks. Once the risks are identified, there are other assessments that need to take place. First, the likelihood of the risk occurrance must be assessed. This is often quantifiable, so numbers may be assigned based on things like MTBF, latency effects, and other known entities. There may be other non-quantifiable contributors to the risk likelihood, however, such that these must be assessed and estimated by experts in the domain. (Don't short-change this process when dealing with critical systems!) Finally, the risk assessment must include the severity of the risk, meaning an estimation of the cost to the project in the event the risk item actually does occur. "Cost to the project" means all associated costs, including schedule delays, human injury, damage to hardware, corruption of data, and so on."
[myweb.lmu.edu/ bjohnson/ cmsi641web/ week15-2.html]
The FTA diagram example "Fault tree analysis - Insulin delivery system" was created using the ConceptDraw PRO diagramming and vector drawing software extended with the Fault Tree Analysis Diagrams solution from the Engineering area of ConceptDraw Solution Park.
"Another way of assessing hazards is using fault tree analysis. In this process, each of the identified hazards is covered by a detailed analysis to find out what might cause it. Either inductive or deductive reasoning is applied. In the case of software hazards, the usual focus is to determine faults that will cause the system to fail to deliver a system service, such as a monitoring system. A "fault tree" is constructed to link all the possible situations together, to help identify the interrelationships of the failures, which modules may cause them, and what "trickle-down effects" there might be. Here is an example of a fault tree, as applied to the Insulin delivery system from Sommerville...
Note that this tree is only partially complete, since only the potential software faults are shown on the diagram. The potential failures involving hardware, such as low battery, blood monitor or sensor failure, patient over-exertion or inattention, or medical staff failure are noticeable by their absence.
The fault tree and safety specification processes are two ways of helping with system risk assessment tasks. Once the risks are identified, there are other assessments that need to take place. First, the likelihood of the risk occurrance must be assessed. This is often quantifiable, so numbers may be assigned based on things like MTBF, latency effects, and other known entities. There may be other non-quantifiable contributors to the risk likelihood, however, such that these must be assessed and estimated by experts in the domain. (Don't short-change this process when dealing with critical systems!) Finally, the risk assessment must include the severity of the risk, meaning an estimation of the cost to the project in the event the risk item actually does occur. "Cost to the project" means all associated costs, including schedule delays, human injury, damage to hardware, corruption of data, and so on."
[myweb.lmu.edu/ bjohnson/ cmsi641web/ week15-2.html]
The FTA diagram example "Fault tree analysis - Insulin delivery system" was created using the ConceptDraw PRO diagramming and vector drawing software extended with the Fault Tree Analysis Diagrams solution from the Engineering area of ConceptDraw Solution Park.
FTA diagram
The vector stencils library "Logic gate diagram" contains 17 element symbols for drawing the logic gate diagrams.
"To build a functionally complete logic system, relays, valves (vacuum tubes), or transistors can be used. The simplest family of logic gates using bipolar transistors is called resistor-transistor logic (RTL). Unlike simple diode logic gates (which do not have a gain element), RTL gates can be cascaded indefinitely to produce more complex logic functions. RTL gates were used in early integrated circuits. For higher speed and better density, the resistors used in RTL were replaced by diodes resulting in diode-transistor logic (DTL). Transistor-transistor logic (TTL) then supplanted DTL. As integrated circuits became more complex, bipolar transistors were replaced with smaller field-effect transistors (MOSFETs); see PMOS and NMOS. To reduce power consumption still further, most contemporary chip implementations of digital systems now use CMOS logic. CMOS uses complementary (both n-channel and p-channel) MOSFET devices to achieve a high speed with low power dissipation." [Logic gate. Wikipedia]
The symbols example "Design elements - Logic gate diagram" was drawn using the ConceptDraw PRO diagramming and vector drawing software extended with the Electrical Engineering solution from the Engineering area of ConceptDraw Solution Park.
Logic gate symbols
The vector stencils library "Instruments" contains 72 symbols of control instruments and measuring devices: meters and gauges, and callouts, text boxes, and inserts.
Use these shapes to create annotated process flow diagrams (PFD), flow control, manufacturing processes, and distribution system diagrams in the ConceptDraw PRO software extended with the Chemical and Process Engineering solution from the Chemical and Process Engineering area of ConceptDraw Solution Park.
www.conceptdraw.com/ solution-park/ engineering-chemical-process
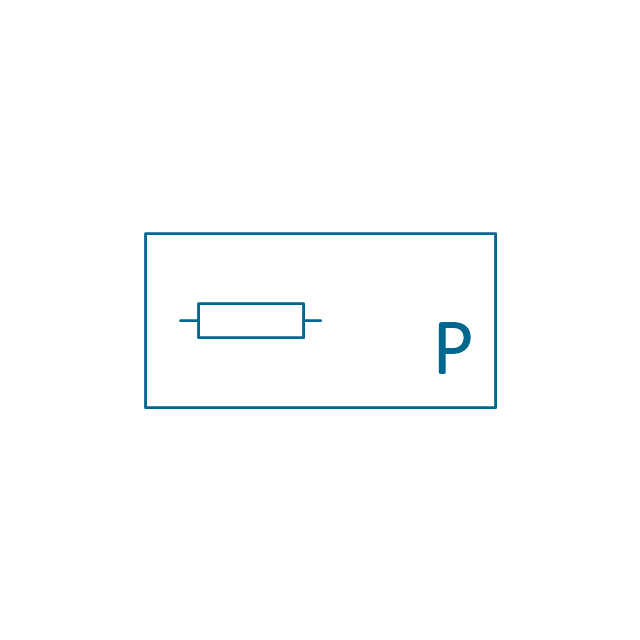
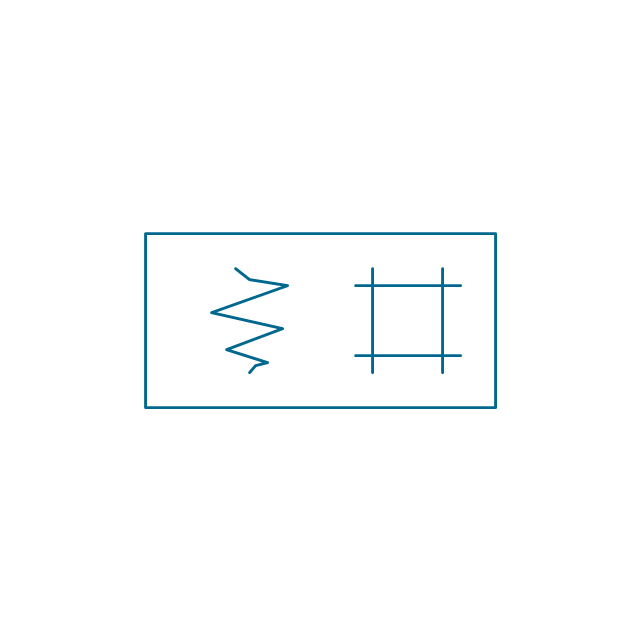
Indicator local

Indicator remote

Indicator auxiliary

CRT local

CRT remote

CRT auxiliary

PLC local

PLC auxiliary

PLC remote

Computer local

Computer auxiliary

Computer remote

Light local

Light remote

Light auxiliary

Indicator auxiliary (dashed)
-instruments---vector-stencils-library.png--diagram-flowchart-example.png)
Indicator remote (dashed)
-instruments---vector-stencils-library.png--diagram-flowchart-example.png)
Steam traced auxiliary

Steam traced remote

Steam traced local

Level meter auxiliary

Level meter remote

Level meter local

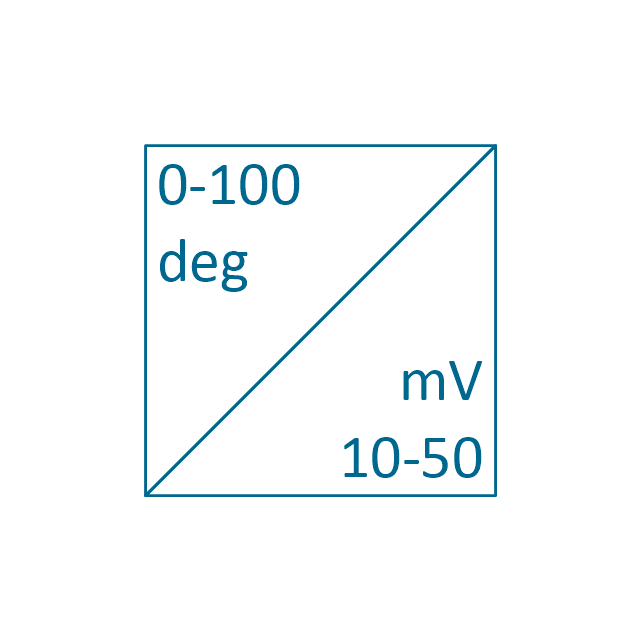
Pressure gauge diaphragm

Pressure gauge

Pressure gauge liquid filled

Strain gauge
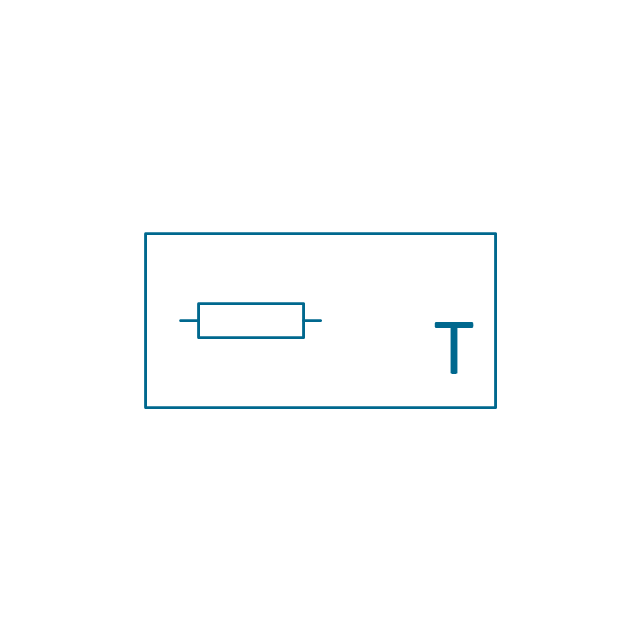
Thermometer bi-metallic

Thermometer gas

Thermometer general

Thermometer glass

Thermometer liquid

Thermometer resistance
Thermometer thermocouple

Flowmeter electromagnetic

Flowmeter general

Flowmeter nozzle

Flowmeter orifice

Flowmeter positive displacement

Flowmeter turbine

Flowmeter variable area

Flowmeter Venturi

Level meter capacitive

Level meter conductive
Level meter displacer

Level meter float
Level meter general

Level meter sonic

Indicator analoque

Indicator digital

Indicator general

Recorder analoque

Recorder digital
Recorder general

Converter
Converter 2 (1st half filled)
-instruments---vector-stencils-library.png--diagram-flowchart-example.png)
Converter 3 (2nd half filled)
-instruments---vector-stencils-library.png--diagram-flowchart-example.png)
Venturi

Venturi (pressure taps)
-instruments---vector-stencils-library.png--diagram-flowchart-example.png)
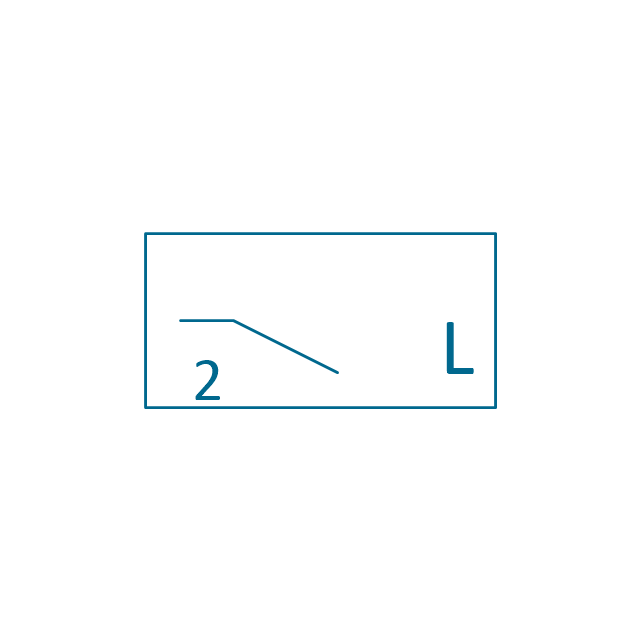
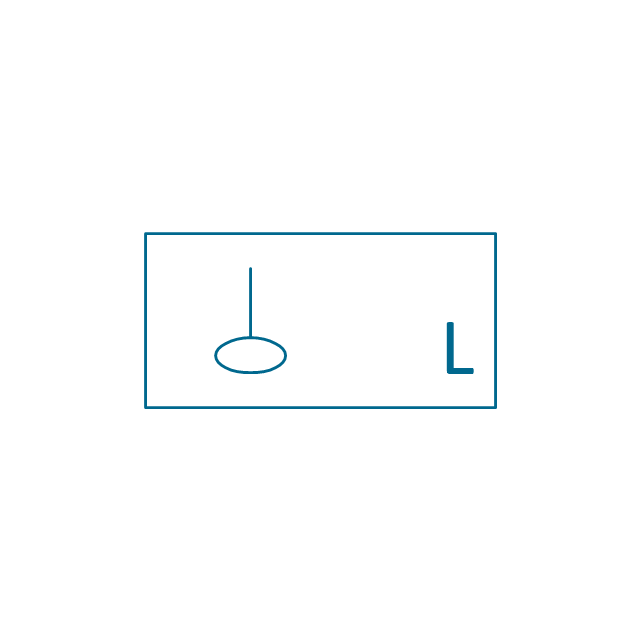
Flowmeter

Rotameter

Vortex sensor

Propeller meter

Generic utility

Operator box

Operator box 2 (1st half filled)
-instruments---vector-stencils-library.png--diagram-flowchart-example.png)
Operator box 3 (2nd half filled)
-instruments---vector-stencils-library.png--diagram-flowchart-example.png)
AND gate

OR gate

NOT gate

Correcting element

Diamond

Electrical Symbols — MOSFET

Electrical Symbols — IGFET

- Logic Gates Png
- Half Circle Png
- Soccer Gate Icon Png
- Analysis Vector Png
- Vector Tree Png
- Tower Crane Vectors Png
- Tree Png
- Futeball Gate Png
- Bullet Icon Text Png
- Football Scoreboard Icon Png
- Referee Png Icon
- Resistor Symbol Png
- Point Bullet Symbol Icon Png
- Plc Icon Png
- Security Illustration Png
- Goalkeeper Icon Png
- Parking Barriers Png
- Operator Png
- Computer Operator Png
- Bullet Symbols Png File