HelpDesk
How to Create a Fault Tree Analysis Diagram (FTD) in ConceptDraw PRO

HelpDesk
How To Create Root Cause Analysis Diagram Using ConceptDraw Office

ConceptDraw Arrows10 Technology

 Fault Tree Analysis Diagrams
This solution extends ConceptDraw PRO v9.5 or later with templates, fault tree analysis example, samples and a library of vector design elements for drawing FTA diagrams (or negative analytical trees), cause and effect diagrams and fault tree diagrams.
"The ideal telecommunication network has the following characteristics: broadband, multi-media, multi-point, multi-rate and economical implementation for a diversity of services (multi-services). The Broadband Integrated Services Digital Network (B-ISDN) intended to provide these characteristics. Asynchronous Transfer Mode (ATM) was promoted as a target technology for meeting these requirements" [Broadband networks. Wikipedia]
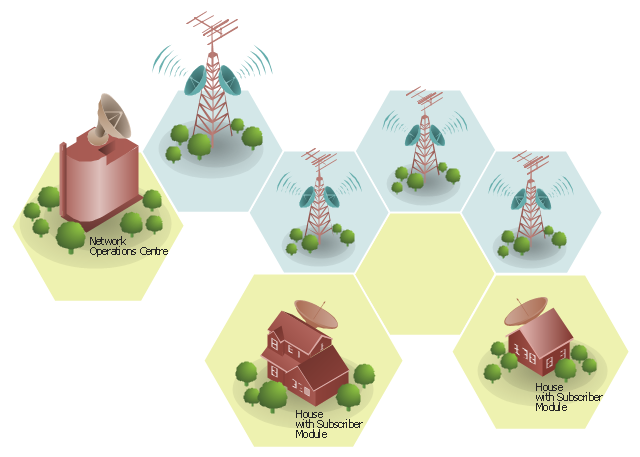
"Wireless broadband is technology that provides high-speed wireless Internet access or computer networking access over a wide area. ...
Wireless networks can feature data rates roughly equivalent to some wired networks, such as that of asymmetric digital subscriber line (ADSL) or a cable modem. Wireless networks can also be symmetrical, meaning the same rate in both directions (downstream and upstream), which is most commonly associated with fixed wireless networks. A fixed wireless network link is a stationary terrestrial wireless connection, which can support higher data rates for the same power as mobile or satellite systems.
Few wireless Internet service providers (WISPs) provide download speeds of over 100 Mbit/ s; most broadband wireless access (BWA) services are estimated to have a range of 50 km (31 mi) from a tower. Technologies used include LMDS and MMDS, as well as heavy use of the ISM bands and one particular access technology was standardized by IEEE 802.16, with products known as WiMAX." [Wireless broadband. Wikipedia]
Wireless broadband is technology that provides high-speed wireless Internet access or computer networking access over a wide area. [Wireless broadband. Wikipedia]
This wireless broadband network diagram example was created using the ConceptDraw PRO diagramming and vector drawing software extended with the Telecommunication Network Diagrams solution from the Computer and Networks area of ConceptDraw Solution Park.
Wireless broadband network diagram
This Active Directory network diagram example depicts types of groups and people assignment rules.
Architecture groups in a Windows Active Directory 2003:
(1) The arrow indicates "may be a member of."
(2) Dotted: Functionality limited to Windows 2003 (without the Windows 2000 compatibility).
(3) Red: Setting possible, but not recommended.
It was drawn on the base of Wikimedia Commons file: AD2003.JPG. [commons.wikimedia.org/ wiki/ File:AD2003.JPG]
This file is licensed under the Creative Commons Attribution-Share Alike 3.0 Unported license. [creativecommons.org/ licenses/ by-sa/ 3.0/ deed.en]
The Active Directory network diagram example "Tree and Forest (Full Trust)" was created using the ConceptDraw PRO diagramming and vector drawing software extended with the Active Directory Diagrams solution from the Computer and Networks area of ConceptDraw Solution Park.
Active Directory network diagram
---active-directory-network-diagram.png--diagram-flowchart-example.png)
- Tree Network Topology Diagram | Fully Connected Network ...
- Network Topologies | Tree Network Topology Diagram | Active ...
- Tree Network Topology Diagram | Fault Tree Analysis Diagrams ...
- Tree Diagram Oftypes Of Communication
- Draw The Tree Diagram In Classification Of Computer Its Types
- Tree Network Topology Diagram | Active Directory Diagram ...
- Hotel Network Topology Diagram | Floor Plans | Process Flowchart ...
- Tree Network Topology Diagram | Active Directory Diagram ...
- Network Topologies | Types of Flowcharts | Tree Network Topology ...
- Tree Network Topology Diagram | Process Flowchart | Network ...
- PROBLEM ANALYSIS. Root Cause Analysis Tree Diagram
- Customer Service Tree Diagram
- Hotel Network Topology Diagram | Seven Management and ...
- Components Of Wireless Network Tree Diagrams
- Tree Network Topology Diagram | Fault Tree Analysis Diagrams ...
- Hotel Network Topology Diagram | Different Types Of Goods Tree ...
- Tree Network Topology Diagram
- Types of Welding in Flowchart | Computer Network Diagrams | Tree ...
- Fault Tree Analysis Diagrams | Root cause analysis tree diagram ...
- Fault Tree Analysis Diagrams