 Circle-Spoke Diagrams
Examples of subject areas that are well suited to this approach are marketing, business, products promotion, process modeling, market, resource, time, and cost analysis. Circle-Spoke Diagrams are successfully used in presentations, conferences, management documents, magazines, reportages, reviews, reports, TV, and social media.
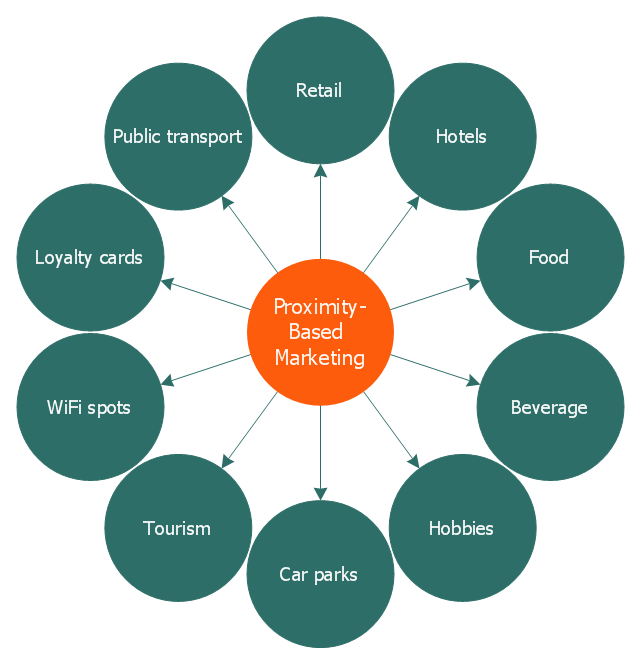
This circle-spoke diagram sample illustrates the proximity marketing.
"Proximity marketing is the localized wireless distribution of advertising content associated with a particular place. Transmissions can be received by individuals in that location who wish to receive them and have the necessary equipment to do so.
Distribution may be via a traditional localized broadcast, or more commonly is specifically targeted to devices known to be in a particular area.
The location of a device may be determined by:
(1) A cellular phone being in a particular cell.
(2) A Bluetooth or WiFi device being within range of a transmitter.
(3) An Internet enabled device with GPS enabling it to request localized content from Internet servers.
(4) A NFC enabled phone can read a RFID chip on a product or media and launch localized content from internet servers.
Communications may be further targeted to specific groups within a given location, for example content in tourist hot spots may only be distributed to devices registered outside the local area.
Communications may be both time and place specific, e.g. content at a conference venue may depend on the event in progress.
Uses of proximity marketing include distribution of media at concerts, information (weblinks on local facilities), gaming and social applications, and advertising." [Proximity marketing. Wikipedia]
The hub-and-spoke diagram example "Proximity based marketing" was created using the ConceptDraw PRO diagramming and vector drawing software extended with the Circle-Spoke Diagrams solution from the area "What is a Diagram" of ConceptDraw Solution Park.
Circle-spoke diagram
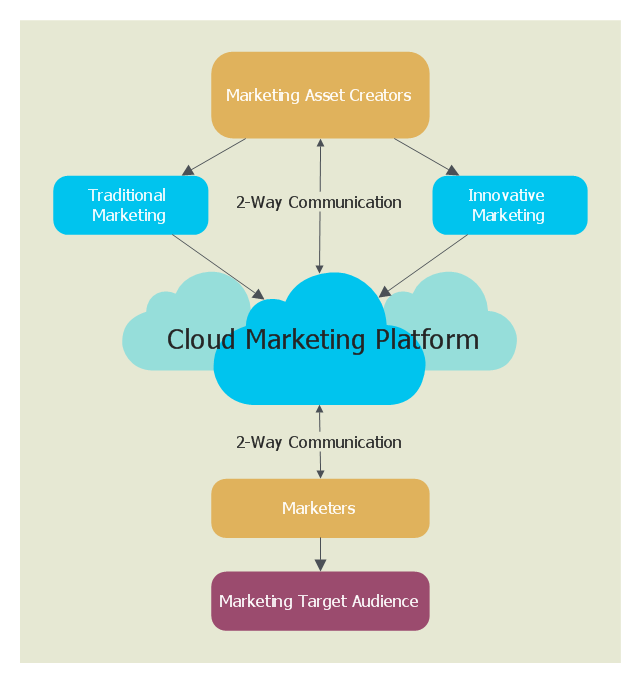
This cloud computing diagram example was drawn on the base of Wikimedia Commons file: CloudMarketingDiagram.png. [commons.wikimedia.org/ wiki/ File:CloudMarketingDiagram.png]
This file is licensed under the Creative Commons Attribution 3.0 Unported license. [creativecommons.org/ licenses/ by/ 3.0/ deed.en]
"Cloud marketing is the process of an organisations efforts to market their goods and services online through integrated digital experiences, by which they are specialised for every single end user. The aim is to use advertising methods to target customers via online applications through social media websites such as Facebook, Twitter and various online portals to target consumers. Cloud marketing platforms are supported with third parties which maintain the platform." [Cloud marketing. Wikipedia]
The example "Cloud marketing diagram" was drawn using ConceptDraw PRO software extended with the Cloud Computing Diagrams solution from the Computer and Networks area of ConceptDraw Solution Park.
Cloud computing diagram example
 AWS Architecture Diagrams
AWS Architecture Diagrams with powerful drawing tools and numerous predesigned Amazon icons and AWS simple icons is the best for creation the AWS Architecture Diagrams, describing the use of Amazon Web Services or Amazon Cloud Services, their application for development and implementation the systems running on the AWS infrastructure. The multifarious samples give you the good understanding of AWS platform, its structure, services, resources and features, wide opportunities, advantages and benefits from their use; solution’s templates are essential and helpful when designing, description and implementing the AWS infrastructure based systems. Use them in technical documentation, advertising and marketing materials, in specifications, presentation slides, whitepapers, datasheets, posters, etc.
This wheel diagram sample was created on the base of figure illustrating the webpage "Chapter 3: Current State of the Ecosystem" of the website of the National Broadband Plan of US Federal Communications Comission (FCC). "The broadband ecosystem includes applications and content: e-mail, search, news, maps, sales and marketing applications used by businesses, user-generated video and hundreds of thousands of more specialized uses. Ultimately, the value of broadband is realized when it delivers useful applications and content to end-users.
Applications run on devices that attach to the network and allow users to communicate: computers, smartphones, set-top boxes, e-book readers, sensors, private branch exchanges (PBX), local area network routers, modems and an ever-growing list of other devices. New devices mean new opportunities for applications and content.
Finally, broadband networks can take multiple forms: wired or wireless, fixed or mobile, terrestrial or satellite. Different types of networks have different capabilities, benefits and costs.
The value of being connected to the network increases as more people and businesses choose to adopt broadband and use applications and devices that the network supports. Several factors contribute to their decisions. These include whether they can afford a connection, whether they are comfortable with digital technology and whether they believe broadband is useful.
Networks, devices and applications drive each other in a virtuous cycle. If networks are fast, reliable and widely available, companies produce more powerful, more capable devices to connect to those networks. These devices, in turn, encourage innovators and entrepreneurs to develop exciting applications and content. These new applications draw interest among end-users, bring new users online and increase use among those who already subscribe to broadband services. This growth in the broadband ecosystem reinforces the cycle, encouraging service providers to boost the speed, functionality and reach of their networks."
[broadband.gov/ plan/ 3-current-state-of-the-ecosystem/ ]
The circle pie chart example "Forces shaping the broadband ecosystem in the US" was created using the ConceptDraw PRO diagramming and vector drawing software extended with the Target and Circular Diagrams solution from the Marketing area of ConceptDraw Solution Park.
www.conceptdraw.com/ solution-park/ marketing-target-and-circular-diagrams
Wheel diagram

HelpDesk
How To Convert a Circle-Spoke Diagram to an Adobe PDF Using ConceptDraw PRO

- Marketing mix - Wheel diagram | Target diagrams - Vector stencils ...
- Relationship marketing | Venn diagram - Relationship marketing ...
- Marketing Diagram Ticket Sales
- Service Marketing Diagram
- Marketing Diagrams | Flow chart Example. Warehouse Flowchart ...
- Relationship marketing | Six Markets Model Chart | Venn Diagram ...
- Flowchart Marketing Process. Flowchart Examples | Marketing ...
- Process Flowchart | Venn diagram - Relationship marketing | Flow ...
- Pie Chart Examples and Templates | Circular diagrams - Vector ...
- 4 Level pyramid model diagram - Information systems types ...
- Process Flowchart | Diagram of a Pyramid | Marketing Charts | With ...
- Relationship marketing | Venn Diagram Examples for Problem ...
- Er Diagram For Small Telecom Marketing Company
- Marketing plan - Circular diagram | Target Diagram | Marketing ...
- Flow Diagram Of Marketing Information System
- Diagram Showing Marketing Variables
- Flowchart Marketing Process. Flowchart Examples | Flowchart ...
- Marketing mix - Wheel diagram | Competitor Analysis | Marketing ...
- Daily Schedule Chart | Marketing | Target Diagram | Marketing Mix ...
- Marketing Management System Er Diagram