 Logistics Flow Charts
Logistics Flow Charts solution extends ConceptDraw PRO v11 functionality with opportunities of powerful logistics management software. It provides large collection of predesigned vector logistic symbols, pictograms, objects and clipart to help you design with pleasure Logistics flow chart, Logistics process flow diagram, Inventory flow chart, Warehouse flowchart, Warehouse management flow chart, Inventory control flowchart, or any other Logistics diagram. Use this solution for logistics planning, to reflect logistics activities and processes of an enterprise or firm, to depict the company's supply chains, to demonstrate the ways of enhancing the economic stability on the market, to realize logistics reforms and effective products' promotion.
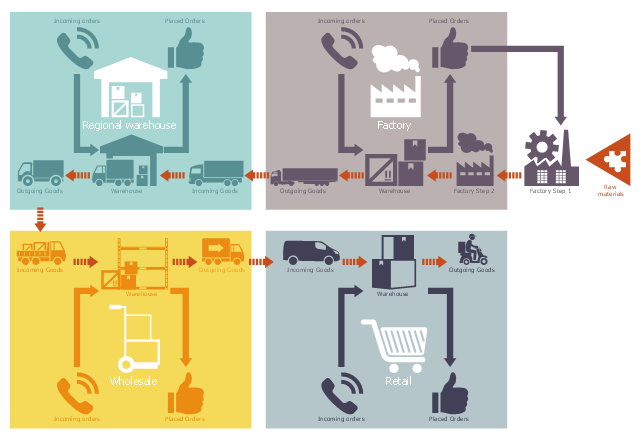
This logistic flow chart sample shows a board design for the beer distribution game.
It was designed on the base of the Wikimedia Commons file: Beer Distribution Game Board.JPG. [commons.wikimedia.org/ wiki/ File:Beer_ Distribution_ Game_ Board.JPG]
This file is licensed under the Creative Commons Attribution-Share Alike 3.0 Unported license. [creativecommons.org/ licenses/ by-sa/ 3.0/ deed.en]
"The beer distribution game (also known as the beer game) is an experiential learning business simulation game created by a group of professors at MIT Sloan School of Management in early 1960s to demonstrate a number of key principles of supply chain management. The game is played by teams of at least four players, often in heated competition, and takes at least one hour to complete. A debriefing session of roughly equivalent length typically follows to review the results of each team and discuss the lessons involved.
The purpose of the game is to understand the distribution side dynamics of a multi-echelon supply chain used to distribute a single item, in this case, cases of beer." [Beer distribution game. Wikipedia]
The logistic flowchart example "Beer distribution game" was created using ConceptDraw PRO diagramming and vector drawing software extended with the Logistics Flow Charts solution from the Business Processes area of ConceptDraw Solution Park.
Logistic flowchart
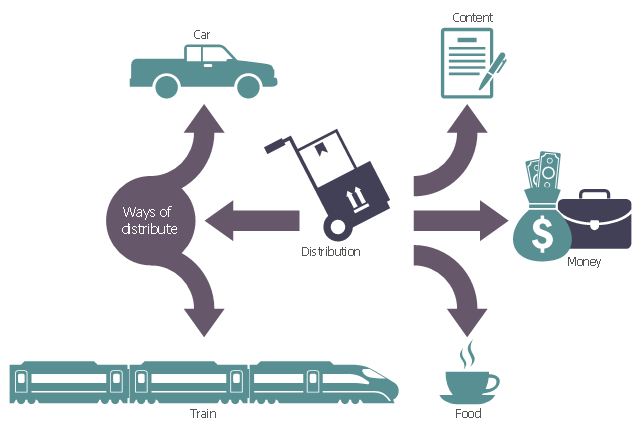
This logistic flow chart sample illustrates the distribution as economics term.
It was designed on the base of the Wikimedia Commons file: 46v1 New-Sheet.jpg.
[commons.wikimedia.org/ wiki/ File:46v1_ New-Sheet.jpg]
"Distribution in economics refers to the way total output, income, or wealth is distributed among individuals or among the factors of production (such as labour, land, and capital). In general theory and the national income and product accounts, each unit of output corresponds to a unit of income. One use of national accounts is for classifying factor incomes and measuring their respective shares, as in National Income. But, where focus is on income of persons or households, adjustments to the national accounts or other data sources are frequently used. Here, interest is often on the fraction of income going to the top (or bottom) x percent of households, the next y percent, and so forth (say in quintiles), and on the factors that might affect them (globalization, tax policy, technology, etc.)." [Distribution (economics). Wikipedia]
The logistic flowchart example "Distribution mind map" was created using ConceptDraw PRO diagramming and vector drawing software extended with the Logistics Flow Charts solution from the Business Processes area of ConceptDraw Solution Park.
Logistic flowchart
 Logistic Dashboard
The powerful tools of Logistic Dashboard solution and specially developed live graphic objects of logistic icons, logistic navigation elements, logistic indicators, logistic charts and logistic maps effectively assist in designing Logistic dashboards, Logistic maps, Logistic charts, diagrams and infographics. The included set of prebuilt samples and quick-start templates, demonstrates the power of ConceptDraw PRO software in logistics management, its assisting abilities in development, realization and analyzing the logistic processes, as well as in perfection the methods of logistics management.
 Frequency Distribution Dashboard
Frequency distribution dashboard solution extends ConceptDraw PRO software with samples, templates and vector stencils libraries with histograms and area charts for drawing the visual dashboards showing frequency distribution of data.
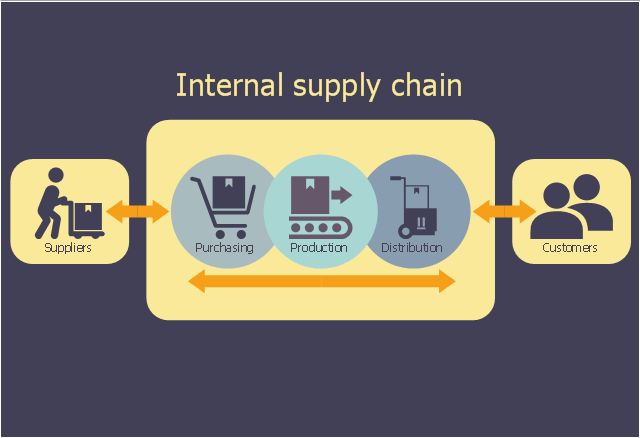
This logistic flow chart sample shows the company's supply chain. It was designed on the base of the Wikimedia Commons file: A company's supply chain (en).png. [commons.wikimedia.org/ wiki/ File:A_ company%27s_ supply_ chain_ (en).png]
This file is licensed under the Creative Commons Attribution-Share Alike 3.0 Unported license. [creativecommons.org/ licenses/ by-sa/ 3.0/ deed.en]
"A supply chain is a system of organizations, people, activities, information, and resources involved in moving a product or service from supplier to customer. Supply chain activities involve the transformation of natural resources, raw materials, and components into a finished product that is delivered to the end customer. In sophisticated supply chain systems, used products may re-enter the supply chain at any point where residual value is recyclable. Supply chains link value chains." [Supply chain. Wikipedia]
The logistic flowchart example "A company's supply chain" was created using ConceptDraw PRO diagramming and vector drawing software extended with the Logistics Flow Charts solution from the Business Processes area of ConceptDraw Solution Park.
Logistic flowchart
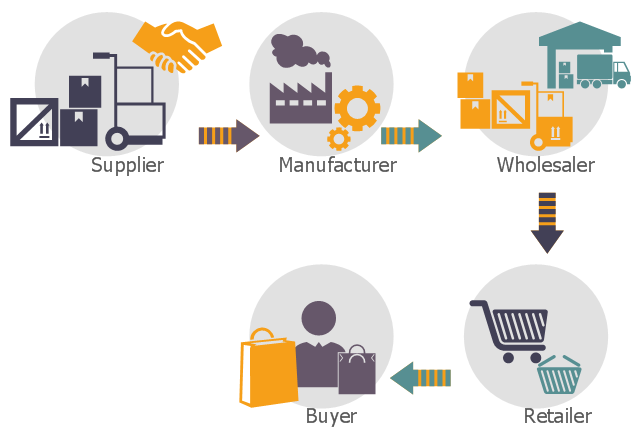
This logistic flow chart sample shows the groups in a supply chain cut out by disintermediation.
It was designed on the base of the Wikimedia Commons file: Disintermediation graphic.PNG. [commons.wikimedia.org/ wiki/ File:Disintermediation_ graphic.PNG]
This file is licensed under the Creative Commons Attribution-Share Alike 3.0 Unported license. [creativecommons.org/ licenses/ by-sa/ 3.0/ deed.en]
"In economics, disintermediation is the removal of intermediaries from a supply chain, or "cutting out the middlemen" in connection with a transaction or a series of transactions. Instead of going through traditional distribution channels, which had some type of intermediary (such as a distributor, wholesaler, broker, or agent), companies may now deal with customers directly, for example via the Internet." [Disintermediation. Wikipedia]
The logistic flowchart example "Groups in a supply chain cut out by disintermediation" was created using ConceptDraw PRO diagramming and vector drawing software extended with the Logistics Flow Charts solution from the Business Processes area of ConceptDraw Solution Park.
Logistic flowchart
 Fishbone Diagrams
The Fishbone Diagrams solution extends ConceptDraw PRO v10 software with the ability to easily draw the Fishbone Diagrams (Ishikawa Diagrams) to clearly see the cause and effect analysis and also problem solving. The vector graphic diagrams produced using this solution can be used in whitepapers, presentations, datasheets, posters, and published technical material.
 Transport Hazard Pictograms
Transport Hazard Pictograms solution includes large variety of specially developed samples with transport hazard symbols and pictograms, and the whole set of predesigned vector transport GHS pictograms download and used with ease from the Transport Hazard Pictograms library. Apply them for quick designing professional-looking infographics and diagrams, use them to create warning signboards and announcements on all stages of the transportation process, to place them on the transport vehicles and warehouses of transportation companies, at the transport documentation and on the websites of transport and logistics companies.
- Distribution Process Flow Chart
- Logistics Flow Charts | Sales Process Flowchart Symbols | Sales ...
- Logistics Flow Charts | Frequency Distribution Dashboard | Network ...
- Frequency Distribution Dashboard | Logistics Flow Charts | Order ...
- Logistics Flow Charts | Frequency Distribution Dashboard | How To ...
- Logistics Flow Charts | Frequency Distribution Dashboard | Cisco ...
- Frequency Distribution Dashboard | Logistics Flow Charts | Audit ...
- Logistics Flow Charts | Flowchart Marketing Process. Flowchart ...
- Logistics Flow Charts | Flowchart Marketing Process. Flowchart ...
- Logistics Flow Charts | Frequency Distribution Dashboard | How to ...