HelpDesk
Event-driven Process Chain (EPC) Diagram Software
An EPC diagram is a type of flowchart used in business process analysis. It shows different business processes through various work flows. The workflows are shown as processes and events that are related to different executes and tasks that allow business workflow to be completed. An EPC diagram shows different business processes through various workflows. The workflows are seen as functions and events that are connected by different teams or people, as well as tasks that allow business processes to be executed. The best thing about this type of enterprise modelling is that creating an EPC diagram is quick and simple as long as you have the proper tool. One of the main usages of the EPC diagrams is in the modelling, analyzing and re-engineering of business processes. With the use of the flowchart, businesses are able to see inefficiencies in the processes and modify to make them more productive. Event-driven process chain diagrams are also used to configure an enterprise resource plaConceptDraw Arrows10 Technology
When you are connecting existing objects you can control the diagram structure by changing selection order. This is how diagramming software should work. You are able to draw a diagram as quickly as the ideas come to you.Cross-Functional Flowcharts in ConceptDraw
Use ConceptDraw PRO enhanced with solutions from ConceptDraw Solution Park to create diagrams to present and explain structures, process flows, logical relationships and networks.HelpDesk
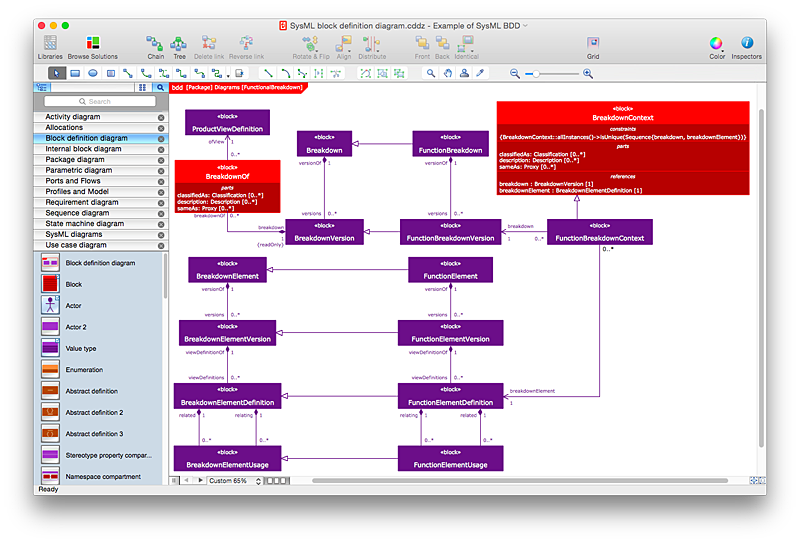
How to Create a SysML Diagram Using ConceptDraw PRO
Systems Modeling Language (SysML) is designed to use for system engineering. It is similar to UML, but much easier to learn. used by to system engineers what UML is to software engineers. Smaller in content and simpler to learn than UML. SysML is focused on standardizing the language used to describe engineering systems. SysML covers a broader range of systems, than can involve personnel, facilities, hardware or electrical components. SysML depicts system using the SysML diagrams. Making a SysML diagram involves many elements that can be managed using SysML solution for ConceptDraw PRO.HelpDesk
How to Draw the Different Types of Pie Charts
Using the Pie Chart, you can visually estimate the relative contribution that different data categories contribute to a whole value. The pie chart displays the statistics in a visual format. The main use of pie charts to show comparisons. The larger piece of the pie, the more the value of this value compared to the rest. Various applications of pie charts can be found in business and education. For business, pie charts can be used to compare the success or failure of the goods or services. They may also be used to display the business market share.- Algorithm Flowchart And C Programming For Selection Sort
- Flowchart Selection Sort Method
- Euclidean algorithm - Flowchart | Basic Flowchart Symbols and ...
- Flow Chart In Data Structure Selection Sort Metheod
- Flow chart Example. Warehouse Flowchart | Flow Chart Online ...
- Basic Flowchart Symbols and Meaning | Structured Systems ...
- How to Create a HR Process Flowchart Using ConceptDraw PRO ...
- Solving quadratic equation algorithm - Flowchart | Euclidean ...
- Structured Systems Analysis and Design Method (SSADM) with ...
- Entity Relationship Diagram Symbols | Basic Flowchart Symbols and ...
- Event Management Data Flow Diagram
- Process Flowchart | Flow Chart for Olympic Sports | Sales Process ...
- HR Flowcharts | HR Flowchart Symbols | Business process diagram ...
- Flowchart | Flow Chart Design - How to Design a Good Flowchart ...
- Various Types Of Resources With Flow Chart And Suitable Pictures
- HR management process - Flowchart | HR Management Software ...
- Process Flowchart | Types of Flowcharts | What is Interactive ...
- Flow Chart for Olympic Sports | Algorithm flowchart - Selection ...
- Basic Flowchart Symbols and Meaning | Contoh Flowchart | Types of ...
- Flow Chart Design - How to Design a Good Flowchart | Business ...


