 Logistic Dashboard
The powerful tools of Logistic Dashboard solution and specially developed live graphic objects of logistic icons, logistic navigation elements, logistic indicators, logistic charts and logistic maps effectively assist in designing Logistic dashboards, Logistic maps, Logistic charts, diagrams and infographics. The included set of prebuilt samples and quick-start templates, demonstrates the power of ConceptDraw PRO software in logistics management, its assisting abilities in development, realization and analyzing the logistic processes, as well as in perfection the methods of logistics management.
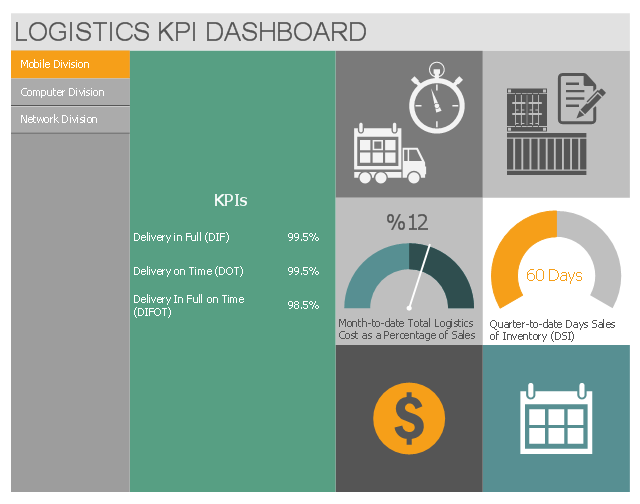
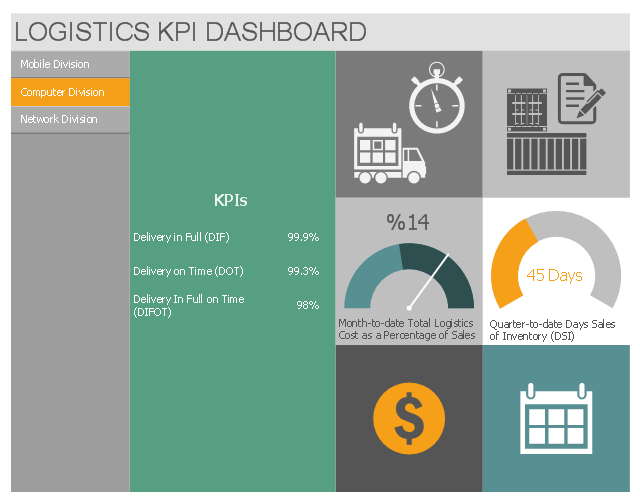
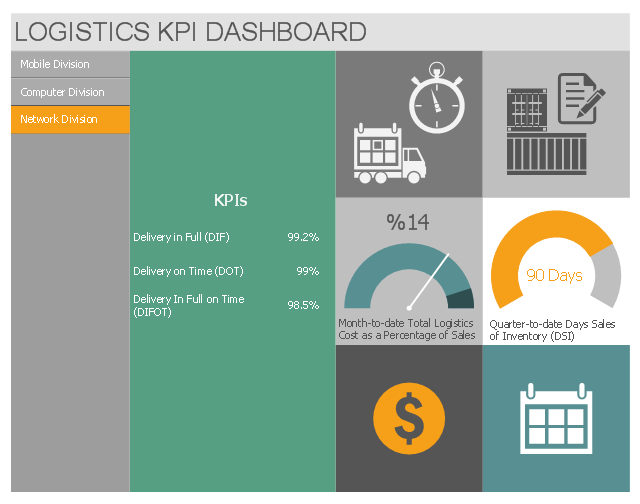
This multipage business dashboard example shows navigation vertical menu and graphic indicators of logistic key performance indicators (KPIs) and business metrics.
"A performance indicator or key performance indicator (KPI) is a type of performance measurement. KPIs evaluate the success of an organization or of a particular activity in which it engages. Often success is simply the repeated, periodic achievement of some levels of operational goal..., and sometimes success is defined in terms of making progress toward strategic goals. Accordingly, choosing the right KPIs relies upon a good understanding of what is important to the organization." [Performance indicator. Wikipedia]
The performance dashboard example "Logistics KPI Dashboard" was designed using ConceptDraw PRO software extended with Logistic Dashboard solution from Business Processes area of ConceptDraw Solution Park.
Mobile Division
Computer Division
Network Division
HelpDesk
How to Make a Logistic Dashboard

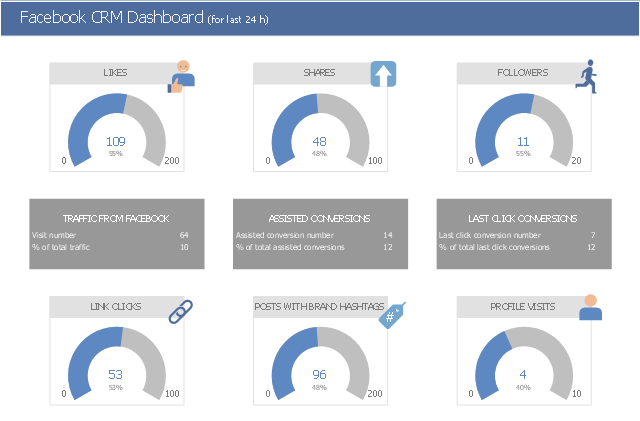
This social media customer service dashboard sample visualizes CRM business metrics and KPIs using graphic indicators.
"Social CRM (customer relationship management) is use of social media services, techniques and technology to enable organizations to engage with their customers. ...
Social CRM has applications in marketing, customer service and sales, including:
* Social Engagement with prospects...
* Social Customer Service...
* Personalized Marketing Strategy" [Social CRM. Wikipedia]
The social CRM dashboard example "Facebook CRM Dashboard" was designed using ConceptDraw PRO software extended with CRM Center Dashboard solution from Management area of ConceptDraw Solution Park.
Business dashboard
 Stakeholder Onion Diagrams
The Stakeholder Onion Diagram is often used as a way to view the relationships of stakeholders to a project goal. A basic Onion Diagram contains a rich information. It shows significance of stakeholders that will have has influence to the success achieve
- Key Performance Indicators Icon
- New Logistic Dashboard Addition to ConceptDraw Solution Park
- Performance Indicators | Dashboard | Logistic Dashboard | Key ...
- Logistic Dashboard | Logistics KPI Dashboard - Template | Logistics ...
- Sample Kpis For Business Development
- Logistics Performance Dashboard - Template | Sales KPIs ...
- Engineering Kpi Dashboard
- Constant improvement of key performance indicators | KPI ...
- Logistic Dashboard | Stakeholder Onion Diagrams | | Kpi Board Layout
- Logistic Dashboard | How to Make a Logistic Dashboard | Logistics ...