Pareto Chart

This example was redesigned from the Wikimedia Commons file: Pareto chart of titanium investment casting defects.svg.
[commons.wikimedia.org/ wiki/ File:Pareto_ chart_ of_ titanium_ investment_ casting_ defects.svg]
This file is licensed under the Creative Commons Attribution-Share Alike 3.0 Unported license. [creativecommons.org/ licenses/ by-sa/ 3.0/ deed.en]
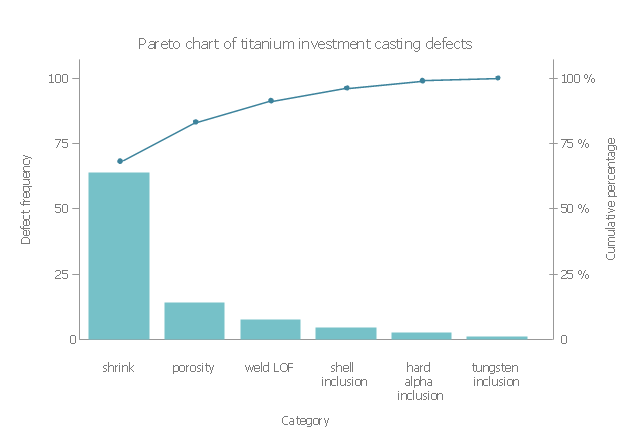
"A Pareto chart, named after Vilfredo Pareto, is a type of chart that contains both bars and a line graph, where individual values are represented in descending order by bars, and the cumulative total is represented by the line.
The left vertical axis is the frequency of occurrence, but it can alternatively represent cost or another important unit of measure. The right vertical axis is the cumulative percentage of the total number of occurrences, total cost, or total of the particular unit of measure. Because the reasons are in decreasing order, the cumulative function is a concave function. ...
The Pareto chart is one of the seven basic tools of quality control." [Pareto chart. Wikipedia]
The Pareto chart example "Titanium investment casting defects" was created using the ConceptDraw PRO software extended with the Seven Basic Tools of Quality solution from the Quality area of ConceptDraw Solution Park.
[commons.wikimedia.org/ wiki/ File:Pareto_ chart_ of_ titanium_ investment_ casting_ defects.svg]
This file is licensed under the Creative Commons Attribution-Share Alike 3.0 Unported license. [creativecommons.org/ licenses/ by-sa/ 3.0/ deed.en]
"A Pareto chart, named after Vilfredo Pareto, is a type of chart that contains both bars and a line graph, where individual values are represented in descending order by bars, and the cumulative total is represented by the line.
The left vertical axis is the frequency of occurrence, but it can alternatively represent cost or another important unit of measure. The right vertical axis is the cumulative percentage of the total number of occurrences, total cost, or total of the particular unit of measure. Because the reasons are in decreasing order, the cumulative function is a concave function. ...
The Pareto chart is one of the seven basic tools of quality control." [Pareto chart. Wikipedia]
The Pareto chart example "Titanium investment casting defects" was created using the ConceptDraw PRO software extended with the Seven Basic Tools of Quality solution from the Quality area of ConceptDraw Solution Park.
Pareto chart example
Pyramid Diagram

Financial Comparison Chart

Purchasing Flow Chart. Purchasing Flowchart Example

The vector stencils library "Management pictograms" contains 72 management pictograms.
Use it to create your management infogram in the ConceptDraw PRO diagramming and vector drawing software.
The flat icons example "Management pictograms - Vector stencils library" is included in the solution "Marketing infographics" from the "Business infographics" area of ConceptDraw Solution Park.
Use it to create your management infogram in the ConceptDraw PRO diagramming and vector drawing software.
The flat icons example "Management pictograms - Vector stencils library" is included in the solution "Marketing infographics" from the "Business infographics" area of ConceptDraw Solution Park.
Accounting management

Activity

Audit management

Board of directors

Budget

Business managemen

Business management tools

Business model

Commanding

Communication

Company

Contract management

Controlling

Coordinating

Core competencies

Corporate strategy

Creativity

Crisis management

Crisis management 2

Decision making

Environmental management

Expenses

External environment

Financial management

Financial management 2

Financial planning

First-level manager

Goal

HR management

Investment management

IT management

Knowledge management

Knowledge management 2

Leadership

Macro environment

Management system

Managerial accounting

Manufacturing management

Market orientation

Marketing management

Marketing strategy

Middle-level manager

Mission

Objectives

Operations management

Organizing

Performance

Performance management

Planning

Policy

PR management

Problem solving

Process management

Product management

Profit

Profit 2

Project management

Quality management

Research and development

Resource management

Resources

Risk management

Sales manegment

Service management

Stakeholder management

Strategic management

Strategic planning

Technology management

Time frame

Time management

Top-level manager

Vision

Relative Value Chart Software

HelpDesk
How to Create Financial Infographics

- Investment Team Icon Png
- Synthetic object construction - Flowchart | Flowcharts | Investment ...
- Process Flowchart | Investment and construction application ...
- Investment Vector Images
- Best Tool for Infographic Construction | Map Infographic Tool ...
- Use Case Diagram For Investment Banking
- ConceptDraw | Press Releases
- Conversion Of Graphics And Pie Chart Table And Flow Bar Chart
- Pareto chart - Titanium investment casting defects | Examples of ...
- Investment Vector Icon