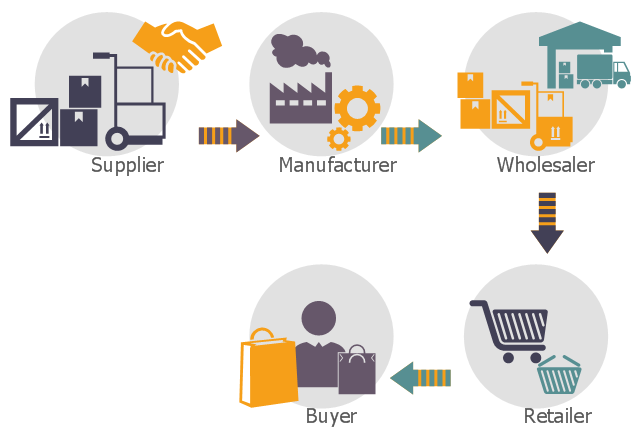
This logistic flow chart sample shows the groups in a supply chain cut out by disintermediation.
It was designed on the base of the Wikimedia Commons file: Disintermediation graphic.PNG. [commons.wikimedia.org/ wiki/ File:Disintermediation_ graphic.PNG]
This file is licensed under the Creative Commons Attribution-Share Alike 3.0 Unported license. [creativecommons.org/ licenses/ by-sa/ 3.0/ deed.en]
"In economics, disintermediation is the removal of intermediaries from a supply chain, or "cutting out the middlemen" in connection with a transaction or a series of transactions. Instead of going through traditional distribution channels, which had some type of intermediary (such as a distributor, wholesaler, broker, or agent), companies may now deal with customers directly, for example via the Internet." [Disintermediation. Wikipedia]
The logistic flowchart example "Groups in a supply chain cut out by disintermediation" was created using ConceptDraw PRO diagramming and vector drawing software extended with the Logistics Flow Charts solution from the Business Processes area of ConceptDraw Solution Park.
Logistic flowchart
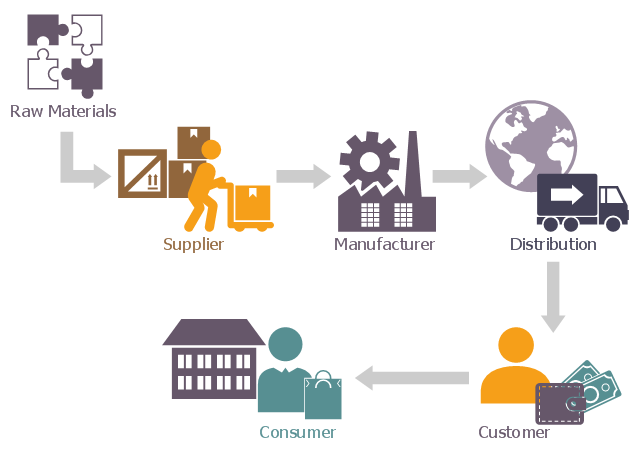
This basic diagram of supply chain network showing the movement of goods from the raw materials stage into the hands of the end consumer.
It was designed on the base of the Wikimedia Commons file: Supply chain network.png. [commons.wikimedia.org/ wiki/ File:Supply_ chain_ network.png]
This file is licensed under the Creative Commons Attribution-Share Alike 4.0 International license. [creativecommons.org/ licenses/ by-sa/ 4.0/ deed.en]
"A supply chain is a system of activities involved in handling, distributing, manufacturing and processing goods in order to move resources from a vendor into the hands of the final consumer. A supply chain is a complex network of interconnected players governed by supply and demand." [Supply chain attack. Wikipedia]
The logistic flowchart example "Supply chain network" was created using ConceptDraw PRO diagramming and vector drawing software extended with the Logistics Flow Charts solution from the Business Processes area of ConceptDraw Solution Park.
Logistic flowchart
Flowchart design. Flowchart symbols, shapes, stencils and icons


This template of inventory performance dynamics dashboard contains 8 column charts of logistic business metrics.
Use it to create your inventory performance dynamics dashboard with ConceptDraw PRO software.
The logistic dashboard template "Inventory Performance Dynamics Dashboard" is included in Logistic Dashboard solution from Business Processes area of ConceptDraw Solution Park.
Use it to create your inventory performance dynamics dashboard with ConceptDraw PRO software.
The logistic dashboard template "Inventory Performance Dynamics Dashboard" is included in Logistic Dashboard solution from Business Processes area of ConceptDraw Solution Park.
Logistic dashboard
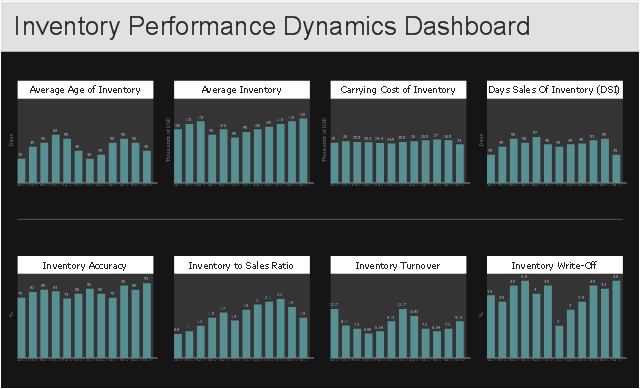
Chart Examples

Value Stream Mapping Icons
The vector stencils library "Value stream mapping" contains 43 VSM symbols.
Use it for drawing value stream maps in the ConceptDraw PRO diagramming and vector drawing software extended with the Value Stream Mapping solution from the Quality area of ConceptDraw Solution Park.
www.conceptdraw.com/ solution-park/ business-value-stream-mapping
Use it for drawing value stream maps in the ConceptDraw PRO diagramming and vector drawing software extended with the Value Stream Mapping solution from the Quality area of ConceptDraw Solution Park.
www.conceptdraw.com/ solution-park/ business-value-stream-mapping
Inventory
Inventory

Information Flow
Shipment
Shipment

Material Flow
Material Pull

FIFO Line
Truck shipment/Logistics
Customer/Supplier

Dedicated Process

Shared Process
Supermarket Parts

Data Box
Workcell

Kaizen Burst

Operator

Other
Production Control
Manual Info
Electronic Information Flow
Production Kanban

Withdrawal Kanban

Signal Kanban
Kanban Post

Sequenced Pull

Load Levelling

MRP/ERP
Go-See

Pull Arrow
Manual Info
Pull Arrow
Timeline Total
Ship
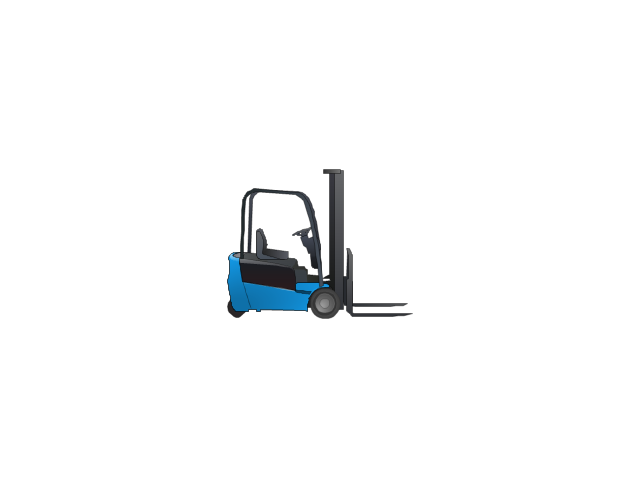
Forklift Truck
Plane

Process with Data
Timeline
Timeline
Supermarket, 2

Supermarket, 3

Safety stock, 2

Safety stock, 3
UML Class Diagram Example for Transport System

The vector stencils library "HR department" contains 50 workflow symbols.
Use this department icon set to draw your HR process flowcharts, workflow diagrams and infographics with the ConceptDraw PRO diagramming and vector drawing software.
The HR pictograms library "HR department" is included in the HR Flowcharts solution from the Management area of ConceptDraw Solution Park.
Accounting

Accounts payable

Accounts receivable

Audit

Bank

Board of directors

Career center

Copy center

Customer service operator

Customer service technician

Data center

Delivery

Design

Devices management

Distribution

Distribution 2

Employee

Engineering

Facilities

Finance

Human resource

Information services

Information systems

International division

International marketing

International sales

Inventory

Legal department

Mail room

Mail service

Management

Manufacturing

Marketing

Motorpool

Online service

Packaging

Payroll

Publications

Purchasing

Quality assurance

Receiving

Reception

Research and development

Scales

Sales growth

Security

Shipping

Suppliers

Telecommunication

Warehouse

The vector stencils library "Value stream mapping" contains 43 VSM symbols.
Use it for drawing value stream maps in the ConceptDraw PRO diagramming and vector drawing software extended with the Value Stream Mapping solution from the Quality area of ConceptDraw Solution Park.
www.conceptdraw.com/ solution-park/ business-value-stream-mapping
Use it for drawing value stream maps in the ConceptDraw PRO diagramming and vector drawing software extended with the Value Stream Mapping solution from the Quality area of ConceptDraw Solution Park.
www.conceptdraw.com/ solution-park/ business-value-stream-mapping
Inventory
Inventory
Information Flow
Shipment
Shipment
Material Flow
Material Pull
FIFO Line
Truck shipment/Logistics
Customer/Supplier
Dedicated Process
Shared Process
Supermarket Parts
Data Box
Workcell
Kaizen Burst
Operator
Other
Production Control
Manual Info
Electronic Information Flow
Production Kanban
Withdrawal Kanban
Signal Kanban
Kanban Post
Sequenced Pull
Load Levelling
MRP/ERP
Go-See
Pull Arrow
Manual Info
Pull Arrow
Timeline Total
Ship
Forklift Truck
Plane
Process with Data
Timeline
Timeline
Supermarket, 2
Supermarket, 3
Safety stock, 2
Safety stock, 3