"Interrelationship digraph is a method to identify relationships among a set of items. Items that have a cause or effect associated on another item are linked together (and given weight) for the purpose of identifying the items most affected or items affecting other items the most, giving emphasis on those items for risk mitigation planning. Items involved in risk management could be risks being mitigated, risk strategies, project activities or resources. ...
This method fosters broad thinking of individuals to identify interrelationships of risk items that affect the whole project, determining critical risk areas that must be dealt first and ensures efficient allocation of project resources." [sce.uhcl.edu/ helm/ Risk_ Man_ WEB/ Planning%20 Worksheet%20 Notes_ files%5Cintrldgm.htm]
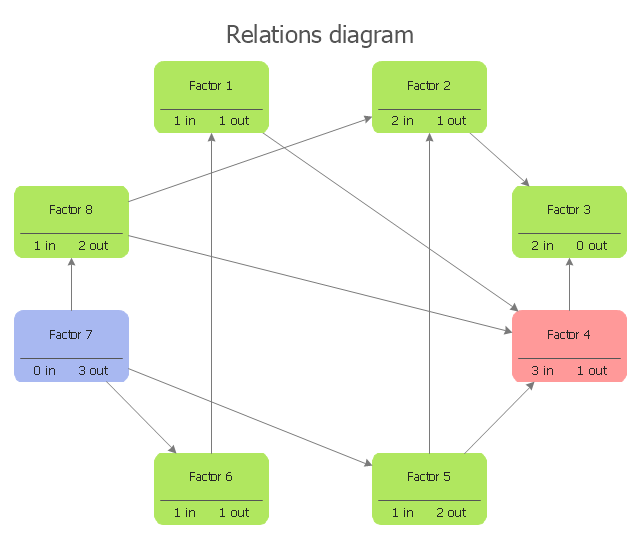
Relation diagram (interrelationship digraph, relationships digram) helps identify what factors are causes and which factors are effects. Factors help establish KPI (Key Performance Indicators) to monitor changes and the effectiveness of corrective actions in resolving a problem.
The relations diagram is one of the Seven Management and Planning Tools (7 MP tools, Seven New Quality Tools).
The relations diagram template for the ConceptDraw PRO diagramming and vector drawing software is included in the solution "Seven Management and Planning Tools" from the Management area of ConceptDraw Solution Park.
This method fosters broad thinking of individuals to identify interrelationships of risk items that affect the whole project, determining critical risk areas that must be dealt first and ensures efficient allocation of project resources." [sce.uhcl.edu/ helm/ Risk_ Man_ WEB/ Planning%20 Worksheet%20 Notes_ files%5Cintrldgm.htm]
Relation diagram (interrelationship digraph, relationships digram) helps identify what factors are causes and which factors are effects. Factors help establish KPI (Key Performance Indicators) to monitor changes and the effectiveness of corrective actions in resolving a problem.
The relations diagram is one of the Seven Management and Planning Tools (7 MP tools, Seven New Quality Tools).
The relations diagram template for the ConceptDraw PRO diagramming and vector drawing software is included in the solution "Seven Management and Planning Tools" from the Management area of ConceptDraw Solution Park.
Interrelationship digraph template
"Interrelationship digraph is a method to identify relationships among a set of items. Items that have a cause or effect associated on another item are linked together (and given weight) for the purpose of identifying the items most affected or items affecting other items the most, giving emphasis on those items for risk mitigation planning. Items involved in risk management could be risks being mitigated, risk strategies, project activities or resources. ...
This method fosters broad thinking of individuals to identify interrelationships of risk items that affect the whole project, determining critical risk areas that must be dealt first and ensures efficient allocation of project resources." [sce.uhcl.edu/ helm/ Risk_ Man_ WEB/ Planning%20 Worksheet%20 Notes_ files%5Cintrldgm.htm]
Relation diagram (interrelationship digraph, relationships digram) helps identify what factors are causes and which factors are effects. Factors help establish KPI (Key Performance Indicators) to monitor changes and the effectiveness of corrective actions in resolving a problem.
The relations diagram is one of the Seven Management and Planning Tools (7 MP tools, Seven New Quality Tools).
The relations diagram template for the ConceptDraw PRO diagramming and vector drawing software is included in the solution "Seven Management and Planning Tools" from the Management area of ConceptDraw Solution Park.
Interrelationship digraph template
"Interrelationship Digraph (ID).
This tool displays all the interrelated cause-and-effect relationships and factors involved in a complex problem and describes desired outcomes. The process of creating an interrelationship digraph helps a group analyze the natural links between different aspects of a complex situation." [Seven Management and Planning Tools. Wikipedia]
"Causality (also referred to as causation) is the relation between an event (the cause) and a second event (the effect), where the second event is understood as a consequence of the first.
In common usage, causality is also the relation between a set of factors (causes) and a phenomenon (the effect). Anything that affects an effect is a factor of that effect. A direct factor is a factor that affects an effect directly, that is, without any intervening factors. (Intervening factors are sometimes called "intermediate factors".) The connection between a cause(s) and an effect in this way can also be referred to as a causal nexus.
Though the causes and effects are typically related to changes or events, candidates include objects, processes, properties, variables, facts, and states of affairs; characterizing the causal relation can be the subject of much debate." [Causality. Wikipedia]
The relations diagram example "Health care" was created using the ConceptDraw PRO diagramming and vector drawing software extended with the solution "Seven Management and Planning Tools" from the Management area of ConceptDraw Solution Park.
Relations diagram

- Interrelationship digraph template
- Interrelationship Digraph Template
- Interrelationship Digraph Example
- Inter Relationship Digraph Tool
- Interrelation Digraph
- Interrelationship Digraph
- Interrelationship Diagram Wikipedia
- Entity Relationship Diagram Symbols | Relations diagram ...
- Entity Relationship Diagram Symbols | PROBLEM ANALYSIS. Root ...
- Interrelationship Diagram Architecture
- Relations diagram - Template
- Interrelationship Wikipedia
- Interrelations Diagram
- Relations diagram - Health care | PROBLEM ANALYSIS. Relations ...
- Interrelation Diagram
- Entity- Relationship Diagram (ERD) with ConceptDraw PRO ...
- Relationship Symbols And Meanings
- Mind Map Interrelationship Digraph Example
- Mind Map Interrelationship Digraph
- Mind Map Interrelationship Digraph Template