Internet solutions with ConceptDraw PRO

The 3D vertical bar graph sample shows the Iran internet users per 100 person from 2000 to 2011. It was designed on the base of the Commons Wikimedia file: Iran internet users per 100 person.png.
[commons.wikimedia.org/ wiki/ File:Iran_ internet_ users_ per_ 100_ person.png]
This file is licensed under the Creative Commons Attribution-Share Alike 3.0 Unported license. [creativecommons.org/ licenses/ by-sa/ 3.0/ deed.en]
The data source is World Bank: [data.worldbank.org/ country/ iran-islamic-republic]
"In 1993 Iran became the second country in the Middle East to be connected to the Internet, and since then the government has made significant efforts to improve the nation's ICT infrastructure. Iran's national Internet connectivity infrastructure is based on two major networks: the public switched telephone network (PSTN) and the public data network. The PSTN provides a connection for end-users to Internet service providers (ISPs) over mostly digital lines and supports modem-based connections. The Data Communication Company of Iran (DCI), a subsidiary of TCI, operates the public data network." [Internet in Iran. Wikipedia]
The 3D column chart example "Iran internet users per 100 person" was created using the ConceptDraw PRO diagramming and vector drawing software extended with the Bar Graphs solution from the Graphs and Charts area of ConceptDraw Solution Park.
3D Column chart

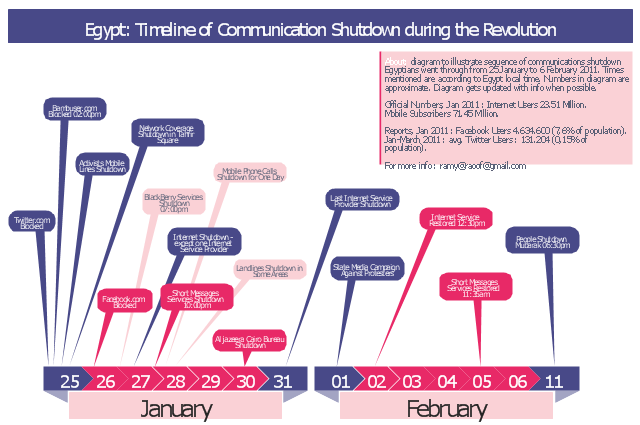
This typography infographics example was redesigned from the Wikimedia Commons file: Egypt timeline of communication shutdown during jan25revolution.jpg. [commons.wikimedia.org/ wiki/ File:Egypt_ timeline_ of_ communication_ shutdown_ during_ jan25revolution.jpg]
This file is licensed under the Creative Commons Attribution 3.0 Unported license. [creativecommons.org/ licenses/ by/ 3.0/ deed.en]
Diagram to illustrate sequence of communications shutdown Egyptians went through from 25 January to 06 February 2011. Times mentioned are according to Egypt local time. Numbers in the diagram are approximate. Last update of the diagram October 2011.
"2011 Internet shutdown.
Diagram to illustrate sequence of communications shutdown Egyptians went through from 25 January to 06 February 2011. Times mentioned are according to Egypt local time. Numbers in the diagram are approximate. Last update of the diagram October 2011.
The 2011 Egyptian protests began on 25 January 2011. As a result, on January 25 and 26, the government blocked Twitter in Egypt and later Facebook was blocked as well.
On January 27, various reports claimed that access to the Internet in the entire country had been shut down. ...
On February 2, connectivity was re-established by the four main Egyptian service providers. A week later, the heavy filtering that occurred at the height of the revolution had ended and bloggers and online activists who had been arrested were released." [Internet in Egypt. Wikipedia]
The example "Egypt timeline of communication shutdown during jan 25 revolution" was created using the ConceptDraw PRO diagramming and vector drawing software extended with the Typography Infographics solition from the area "What is infographics" in ConceptDraw Solution Park.
Infographics
- Internet Connectivity . Computer and Network Examples ...
- Internet Connectivity . Computer and Network Examples | Hotel ...
- Internet Connectivity . Computer and Network Examples | Network ...
- Internet Connectivity . Computer and Network Examples | 3D Column ...
- Satellite telecom network diagram | Internet Connectivity . Computer ...
- This Statement Is True Or False Internet Is An Example Of Man
- Internet Connectivity . Computer and Network Examples ...
- Network Architecture | Internet Connectivity . Computer and Network ...
- Internet Connectivity . Computer and Network Examples | Internet ...
- Internet Connectivity . Computer and Network Examples | Satellite ...
- Cisco Network Diagrams | Internet Connectivity . Computer and ...
- Wireless broadband network diagram | Internet Connectivity ...
- AWS | Internet Connectivity . Computer and Network Examples ...
- Internet Connectivity . Computer and Network Examples | Mobile ...
- Internet Connectivity . Computer and Network Examples | Wide area ...
- Personal area (PAN) networks. Computer and Network Examples ...
- Storage area networks (SAN). Computer and Network Examples ...
- Internet Connectivity . Computer and Network Examples | Wireless ...
- Network Topologies | Internet Connectivity . Computer and Network ...
- Example Of Wireless Internet