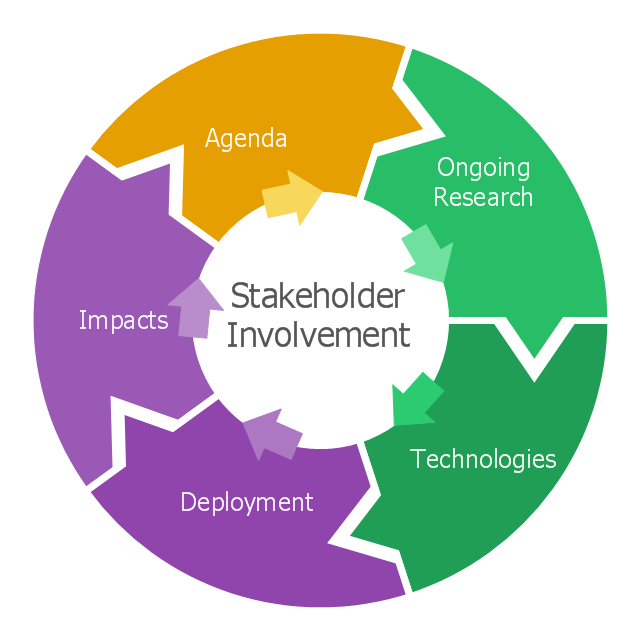
This arrow loop cycle diagram sample was created on the base of the figure illustrating the webpage "Exploratory Advanced Research Program Hand-Off Workshops" from the US Department of Transportation - Federal Highway Administration (FHWA) website. "The FHWA’s research and technology innovation life cycle illustrates that research and technology development are not insular activities, but integrated processes that together constitute a system.
Following general workshop discussion, a number of common issues emerged among the groups. These centered around the research life cycle, communicating the value of exploratory advanced research, and continued project funding. It was felt that there is a general need to better describe the research and deployment cycle specific to highway transportation and possibly to highway research fields, such as materials or system planning. Research life cycle diagrams show a very linear, chronological process but it is not necessarily that way in reality." [fhwa.dot.gov/ advancedresearch/ pubs/ 11034/ ]
The arrow loop diagram example "Innovation life cycle" was created using the ConceptDraw PRO diagramming and vector drawing software extended with the Target and Circular Diagrams solution from the Marketing area of ConceptDraw Solution Park.
www.conceptdraw.com/ solution-park/ marketing-target-and-circular-diagrams
Arrow loop cycle diagram
This hexagon diagram sample was redesigned from the Wikipedia file: Virtuous circle in macroeconomics.svg. "An example of the use of a virtuous circle in macroeconomics."
[en.wikipedia.org/ wiki/ File:Virtuous_ circle_ in_ macroeconomics.svg]
"A virtuous circle and a vicious circle (also referred to as virtuous cycle and vicious cycle) are economic terms. They refer to a complex chain of events that reinforces itself through a feedback loop. A virtuous circle has favorable results, while a vicious circle has detrimental results.
Both circles are complexes of events with no tendency towards equilibrium (at least in the short run). Both systems of events have feedback loops in which each iteration of the cycle reinforces the previous one (positive feedback). These cycles will continue in the direction of their momentum until an external factor intervenes and breaks the cycle. The prefix "hyper-" is sometimes used to describe these cycles if they are extreme. The best-known example of a vicious circle is hyperinflation. ...
Example in macroeconomics.
Virtuous circle.
Economic growth can be seen as a virtuous circle. It might start with an exogenous factor such as technological innovation. As people get familiar with the new technology, there could be learning curve effects and economies of scale. This could lead to reduced costs and improved production efficiencies. In a competitive market structure, this will probably result in lower average prices or a decrease in employment as it takes fewer workers to produce the same output. As prices decrease, consumption could increase and aggregate output also. Increased levels of output lead to more learning and scale effects and a new cycle starts."
[en.wikipedia.org/ wiki/ Virtuous_ circle_ and_ vicious_ circle]
The crystal diagram example "Virtuous circle (macroeconomics)" was created using the ConceptDraw PRO diagramming and vector drawing software extended with the Target and Circular Diagrams solution from the Marketing area of ConceptDraw Solution Park.
www.conceptdraw.com/ solution-park/ marketing-target-and-circular-diagrams
Hexagon diagram
---crystal-diagram.png--diagram-flowchart-example.png)
 Circular Arrows Diagrams
Circular Arrows Diagrams solution extends ConceptDraw PRO v10 with extensive drawing tools, predesigned samples, Circular flow diagram template for quick start, and a library of ready circular arrow vector stencils for drawing Circular Arrow Diagrams, Segmented Cycle Diagrams, and Circular Flow Diagrams. The elements in this solution help managers, analysts, business advisers, marketing experts, scientists, lecturers, and other knowledge workers in their daily work.
This circular arrows diagram sample shows the innovation life cycle stages. It was designed on the base of the from the website of the Federal Highway Administration (FHWA) of the U.S. Department of Transportation (DOT). [fhwa.dot.gov/ advancedresearch/ pubs/ 11034/ ]
"Innovation is defined simply as a "new idea, device, or method". However, innovation is often also viewed as the application of better solutions that meet new requirements, unarticulated needs, or existing market needs. This is accomplished through more-effective products, processes, services, technologies, or business models that are readily available to markets, governments and society." [Innovation. Wikipedia]
The diagram example "Innovation life cycle" was created using the ConceptDraw PRO diagramming and vector drawing software extended with the Circular Arrows Diagrams solution from the area "What is a Diagram" of ConceptDraw Solution Park.
Circular arrows diagram
 Target and Circular Diagrams
This solution extends ConceptDraw PRO software with samples, templates and library of design elements for drawing the Target and Circular Diagrams.
 Project Management Area
Project Management area provides Toolbox solutions to support solving issues related to planning, tracking, milestones, events, resource usage, and other typical project management functions.
Circular Flow Diagram Template

This vector stencils library contains 184 round icons.
Use it to design cloud computing infographics and diagrams with ConceptDraw PRO software.
"Though service-oriented architecture advocates "everything as a service" (with the acronyms EaaS or XaaS or simply aas), cloud-computing providers offer their "services" according to different models, which happen to form a stack: infrastructure-, platform- and software-as-a-service.
Infrastructure as a service (IaaS)
In the most basic cloud-service model ... providers of IaaS offer computers — physical or (more often) virtual machines — and other resources. IaaS refers to online services that abstract the user from the details of infrastructure like physical computing resources, location, data partitioning, scaling, security, backup etc.
Platform as a service (PaaS)
PaaS vendors offer a development environment to application developers. The provider typically develops toolkit and standards for development and channels for distribution and payment. In the PaaS models, cloud providers deliver a computing platform, typically including operating system, programming-language execution environment, database, and web server. Application developers can develop and run their software solutions on a cloud platform without the cost and complexity of buying and managing the underlying hardware and software layers.
Software as a service (SaaS)
In the software as a service (SaaS) model, users gain access to application software and databases. Cloud providers manage the infrastructure and platforms that run the applications. SaaS is sometimes referred to as "on-demand software" and is usually priced on a pay-per-use basis or using a subscription fee.
In the SaaS model, cloud providers install and operate application software in the cloud and cloud users access the software from cloud clients. Cloud users do not manage the cloud infrastructure and platform where the application runs. This eliminates the need to install and run the application on the cloud user's own computers, which simplifies maintenance and support. Cloud applications differ from other applications in their scalability — which can be achieved by cloning tasks onto multiple virtual machines at run-time to meet changing work demand." [Cloud computing. Wikipedia]
The vector stencils library "Cloud round icons" is included in the Cloud Computing Diagrams solution from the Computer and Networks area of ConceptDraw Solution Park.
Add
Analysis
API
App
Archive
Back
Backup
Book
Books
Box
Bug
Calculation
Calendar
Call
Car
CD
Certificate
Cloud alert
Cloud analysis
Cloud authorization
Cloud collaboration
Cloud communications
Cloud computing
Cloud configuration
Cloud connectivity
Cloud control
Cloud cost calculation
Cloud database
Cloud download
Cloud drive
Cloud error
Cloud failure
Cloud FAQ
Cloud feedback
Cloud files
Cloud gateway
Cloud hosting
Cloud info
Cloud Internet storage
Cloud lock
Cloud locked
Cloud mail
Cloud music
Cloud paperless office
Cloud performance
Cloud photo
Cloud safe
Cloud search
Cloud security
Cloud servers
Cloud services
Cloud shopping
Cloud success
Cloud synchronization
Cloud tech support
Cloud transfer
Cloud unlocked
Cloud upload
Cloud video
Code
Collaboration
Communication
Community cloud
Contact list
Content
CPU
Database
Datacenter
Data storage
Desktop
Display
Document
Documents
Dollar
Done
Down
Download
E-commerce
Earth
Email
Encryption
Error
Ethernet
Euro
Failure
Feed
File
Files
Filter
Firewall
Flash drive
Folder
Forward
Hard drive
Hardware
Health
Health monitoring
Home
Hosting
Image
Info
Innovation
Key
Keyboard
Laptop
Letter
Lightning
Link
List
Location
Lock
Log
Login
Logout
Mail
Mail list
Marketplace
Memory (RAM)
Message
Minus
Mobile
Mobile cloud computing
Mouse
Music player
Network
Notebook
Notification
Package
Patch
Performance
Personal cloud
Phone book
Photo
Plug
Pound
Power
Power button
Process
Processing
Puzzles
Question sign
Recovery
Remote
Repair
Restore
Rocket (Logic app)
Router
Safety
Schedule
Script
SDK
Search (Scan)
Security
Server
Server rack
Services
Sharing
Shopping basket
Sign in
Smartphone
Song
Sound
Stethoscope
Stickman
Subscription
Sync
Tablet
Tech support
Time
Top rated
Transfer
Unlink
Unlock
Up
Upload
User
Video mail
View (visual)
Virus protection
Waste bin
Web
Wifi
Wireless
Yen sign
Relative Circular Diagram

- Research cycle - Circle diagram | Innovation life cycle - Arrow loop ...
- Systems development life cycle | Innovation life cycle - Arrow loop ...
- Process Flowchart | Innovation life cycle - Arrow loop diagram ...
- Innovation life cycle - Arrow loop diagram | Target and Circular ...
- Research onion diagram | Research cycle - Circle diagram ...
- Innovative Arrows Png Circle
- Innovation life cycle - Arrow loop diagram
- Innovation life cycle - Arrow loop diagram
- Innovation life cycle - Arrow loop diagram | Target and Circular ...
- Innovation life cycle - Arrow loop diagram | Process Flowchart ...