Percentage Spider Chart
ConceptDraw PRO creates drawings, diagrams and charts with great visual appeal in Mac OS X. This sample shows the Spider Chart that represents the buyer perceptions of the leather footwear industries in Brazil, India and Italy.How To use House Electrical Plan Software
How we can conduct the electricity at house correctly without a plan? It is impossible. The House electrical diagram depicts locations of switches, outlets, dimmers and lights, and lets understand how you will connect them. But design of House Electrical Plan looks a complex task at a glance, which requires a lot of tools and special experience. But now all is simple with all-inclusive floor plan software - ConceptDraw PRO. As a house electrical plan software, the ConceptDraw PRO contains libraries with a large range of professional lighting and electrical symbols, ready-to-use electrical plans samples and examples, and built-in templates for creating great-looking Home floor electrical plans. It is a fastest way to draw Electrical circuit diagrams, Electrical wiring and Circuit schematics, Digital circuits, Electrical equipment, House electrical plans, Satellite television, Cable television, Home cinema, Closed-circuit television when are used the tools of Electric and Telecom Plans Solution from ConceptDraw Solution Park. Files created in Visio for Mac app can be easily imported to ConceptDraw PRO. Also you may import stencils and even libraries. Try for free an alternative to Visio that Apple users recommend.
 Food Court
Use the Food Court solution to create food art. Pictures of food can be designed using libraries of food images, fruit art and pictures of vegetables.
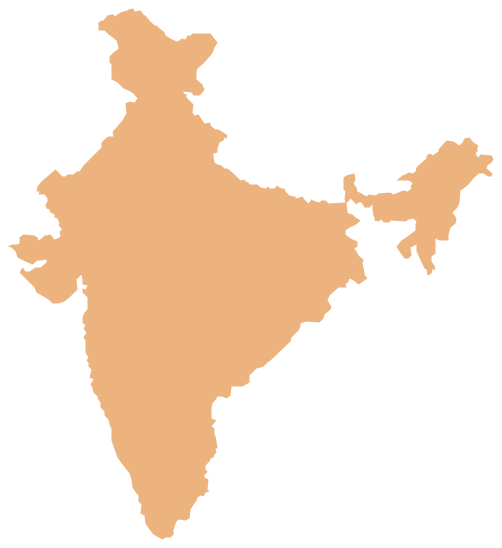
Geo Map - Asia - India
India, officially the Republic of India (Bharat Ganrajya), is a country in South Asia. The vector stencils library India contains contours for ConceptDraw PRO diagramming and vector drawing software. This library is contained in the Continent Maps solution from Maps area of ConceptDraw Solution Park.Geo Map - Asia - Myanmar
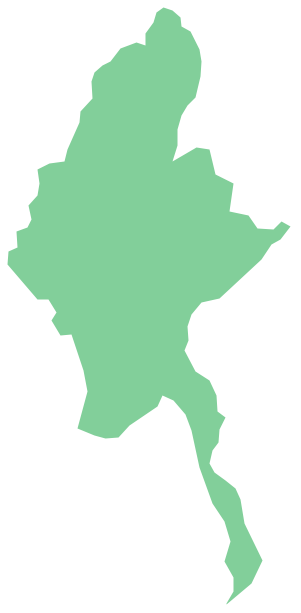
Burma, officially the Republic of the Union of Myanmar, commonly shortened to Myanmar, is a sovereign state in Southeast Asia bordered by Bangladesh, India, China, Laos and Thailand. The vector stencils library Myanmar contains contours for ConceptDraw PRO diagramming and vector drawing software. This library is contained in the Continent Maps solution from Maps area of ConceptDraw Solution Park.Geo Map - Asia - Sri Lanka
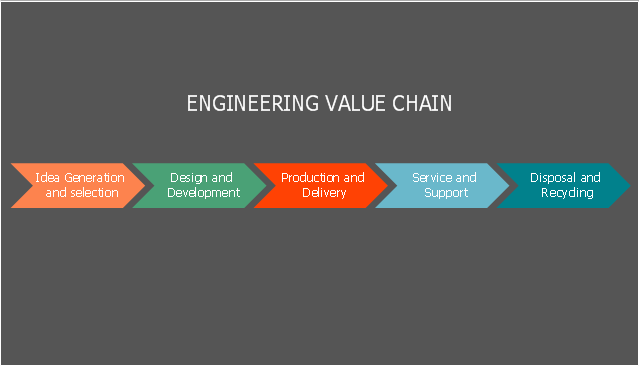
Sri Lanka, officially the Democratic Socialist Republic of Sri Lanka, is an island country in the northern Indian Ocean off the southern coast of the Indian subcontinent in South Asia; known until 1972 as Ceylon, Sri Lanka has maritime borders with India to the northwest and the Maldives to the southwest. The vector stencils library Sri Lanka contains contours for ConceptDraw PRO diagramming and vector drawing software. This library is contained in the Continent Maps solution from Maps area of ConceptDraw Solution Park.This step chart sample shows engineering value chain. It was designed on the base of the Wikimedia Commons file: The engineering value chain.png. "The engineering value chain (EVC) refers to a series of engineering activities and capabilities contributing to value creation encompassing essential elements such as idea generation & selection, design & development, production & delivery, service & support, and disposal & recycling for example." [commons.wikimedia.org/ wiki/ File:The_ engineering_ value_ chain.png]
This file is licensed under the Creative Commons Attribution-Share Alike 3.0 Unported license. [creativecommons.org/ licenses/ by-sa/ 3.0/ deed.en]
The diagram example "Step chart - Value chain" was created using the ConceptDraw PRO diagramming and vector drawing software extended with the Marketing Diagrams solution from the Marketing area of ConceptDraw Solution Park.
Geo Map - Asia - Thailand
Thailand, officially the Kingdom of Thailand, is a country located at the centre of the Indochina peninsula in Southeast Asia. The vector stencils library Thailand contains contours for ConceptDraw PRO diagramming and vector drawing software. This library is contained in the Continent Maps solution from Maps area of ConceptDraw Solution Park.Geo Map - Asia - Turkmenistan
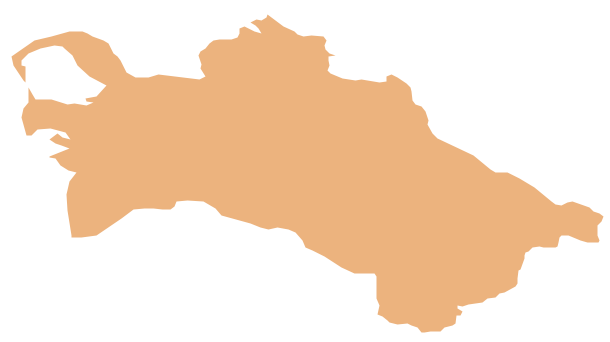
Turkmenistan, formerly also known as Turkmenia, is one of the Turkic states in Central Asia. The vector stencils library Turkmenistan contains contours for ConceptDraw PRO diagramming and vector drawing software. This library is contained in the Continent Maps solution from Maps area of ConceptDraw Solution Park.Geo Map - Asia - Bangladesh
Bangladesh, officially the People's Republic of Bangladesh, is a country in South Asia. The vector stencils library Bangladesh contains contours for ConceptDraw PRO diagramming and vector drawing software. This library is contained in the Continent Maps solution from Maps area of ConceptDraw Solution Park.Matrix Organization Structure
Matrix organizational structure is one of the main forms of structures which is actively used by organizations to carry forth the functions of a company visually and effectively. Now we have ConceptDraw PRO diagramming and vector drawing software extended with 25 Typical Orgcharts solution from the Management area of ConceptDraw Solution Park which will help easy represent matrix organizational structure of any degree of complexity.Geo Map - Asia - Bhutan
Bhutan, officially the Kingdom of Bhutan, is a landlocked country in South Asia located at the eastern end of the Himalayas. The vector stencils library Bhutan contains contours for ConceptDraw PRO diagramming and vector drawing software. This library is contained in the Continent Maps solution from Maps area of ConceptDraw Solution Park.
 Area Charts
Area Charts are used to display the cumulative totals over time using numbers or percentages; or to show trends over time among related attributes. The Area Chart is effective when comparing two or more quantities. Each series of data is typically represented with a different color, the use of color transparency in an object’s transparency shows overlapped areas and smaller areas hidden behind larger areas.
- Er Diagram Of Digital India
- Pie Chart On Irrigation Facilities In India
- India Economy In 2017 On Pie Diagram
- Food Security In India With Diagram And Graphs
- Agriculture Of India Pie Diagram
- Mineral Resources Of India Bar Diagram
- Area Charts | Bar Diagram Of Planning In Agriculture In India
- India Map Line Diagram
- Pie Chart Of Sectors Of Indian Economy
- Pie Chart Of Crop Production In India
- Food Security Of India Chart
- Geo Map - Asia - India | 6 sigma | Independent regional networks ...
- Continent Maps | Diagram Of Pie Chart On World Education ...
- Pie Chart On Irrigational Facilities In India
- Example Of Pie Diagram Related To Agriculture India
- UML activity diagram - Cash withdrawal from ATM | Diagramcash ...
- Diagram Map Of India
- Diagram And Pie Chart Of Bank Of India
- Office Layout Plans | Pi Diagram Of Land Resources Of India


