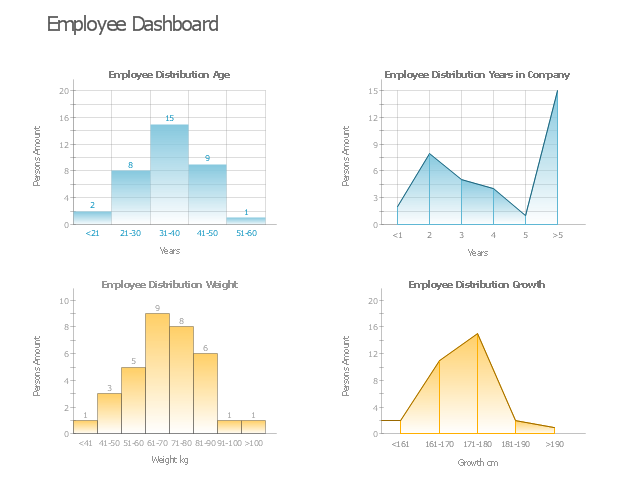
This HR dashboard example include histograms "Employee Distribution by Age" and "Employee Distribution by Weight", and area charts "Employee Distribution by Years in Company" and "Employee Distribution by Growth".
"Human resources is the set of individuals who make up the workforce of an organization, business sector, or economy. "Human capital" is sometimes used synonymously with human resources, although human capital typically refers to a more narrow view (i.e., the knowledge the individuals embody and can contribute to an organization). Likewise, other terms sometimes used include "manpower", "talent", "labour", or simply "people". The professional discipline and business function that oversees an organization's human resources is called human resource management (HRM, or simply HR)." [Human resources. Wikipedia]
The example "HR dashboard" was created using the ConceptDraw PRO diagramming and vector drawing software extended with the Frequency Distribution Dashboard solution from the area "What is a Dashboard" of ConceptDraw Solution Park.
Visual dashboard
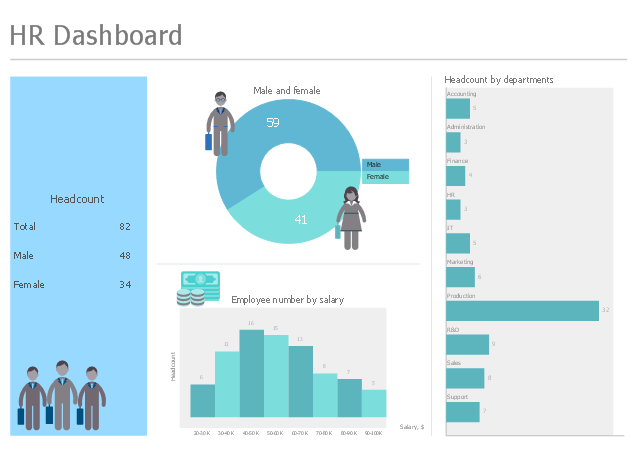
This HR dashboard sample shows business metrics and KPIs for human resources management: headcount, male and female ratio, employee distribution by salary, headcount by departments.
"Human Resource Management (HRM or HR) is the management of human resources. It is designed by the HR Department to maximize employee performance in service of an employer's strategic objectives. HR is primarily concerned with the management of people within organizations, focusing on policies and on systems. HR departments are responsible for overseeing employee-benefits design, employee recruitment, training and development, performance appraisal, and rewarding (e.g., managing pay and benefit systems)." [Human resource management. Wikipedia]
The human resources dashboard example "HR Dashboard" was designed using ConceptDraw PRO software extended with HR Dashboard solution from Management area of ConceptDraw Solution Park.
Human resources dashboard
 HR Flowcharts
Human resource management diagrams show recruitment models, the hiring process and human resource development of human resources.
 Flowcharts
The Flowcharts solution for ConceptDraw DIAGRAM is a comprehensive set of examples and samples in several varied color themes for professionals that need to represent graphically a process. Solution value is added by the basic flow chart template and shapes' libraries of flowchart notation. ConceptDraw DIAGRAM flow chart creator lets one depict the processes of any complexity and length, as well as design the Flowchart either vertically or horizontally.
TQM Software — Build Professional TQM Diagrams

Human Resource Development

Six Markets Model Chart

Collaboration in a Project Team

- Digital Dashboard In Hrm
- How to Create a HR Process Flowchart Using ConceptDraw PRO ...
- HR dashboard | Projects HR dashboard | Frequency Distribution ...
- Employee distribution - HR dashboard | HR Dashboard | Frequency ...
- HR management process - Flowchart | Components of competency ...
- Employee distribution - HR dashboard | HR dashboard | Frequency ...
- Employee distribution - HR dashboard | HR dashboard | Projects HR ...
- Employee distribution - HR dashboard | Frequency Distribution ...
- Digital Dashboards In Hrm
- Projects HR dashboard | Employee distribution - HR dashboard ...