 Physics
Physics solution extends ConceptDraw DIAGRAM software with templates, samples and libraries of vector stencils for drawing the physical illustrations, diagrams and charts.
Physics Diagrams
HelpDesk
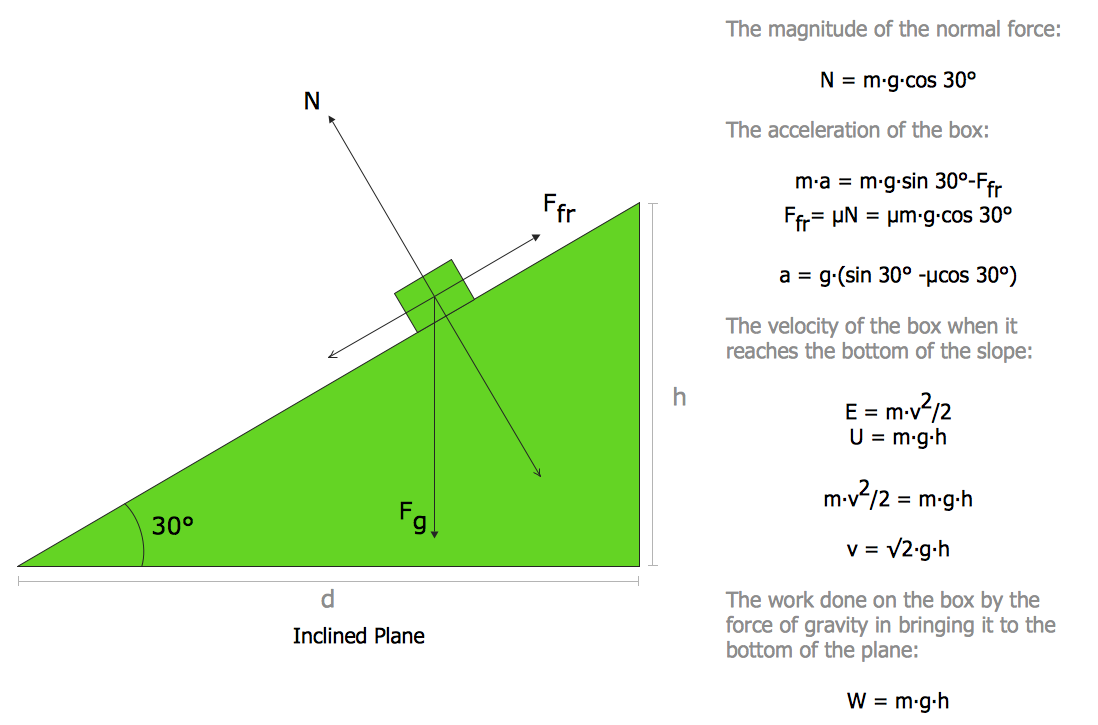
How to Draw Physics Diagrams

 AWS Architecture Diagrams
AWS Architecture Diagrams with powerful drawing tools and numerous predesigned Amazon icons and AWS simple icons is the best for creation the AWS Architecture Diagrams, describing the use of Amazon Web Services or Amazon Cloud Services, their application for development and implementation the systems running on the AWS infrastructure. The multifarious samples give you the good understanding of AWS platform, its structure, services, resources and features, wide opportunities, advantages and benefits from their use; solution’s templates are essential and helpful when designing, description and implementing the AWS infrastructure-based systems. Use them in technical documentation, advertising and marketing materials, in specifications, presentation slides, whitepapers, datasheets, posters, etc.
 IDEF Business Process Diagrams
Use the IDEF Business Process Diagrams solution to create effective database designs and object-oriented designs, following the integration definition methodology.
HelpDesk
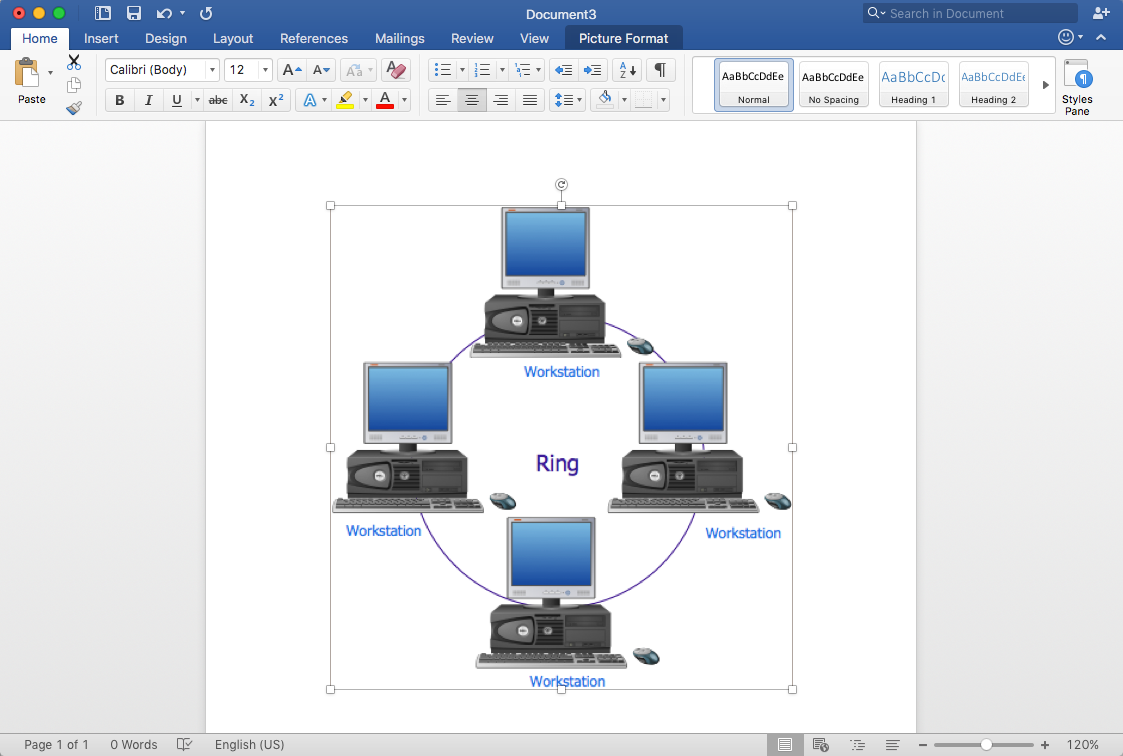
How to Add a Network Diagram to MS Word
 Healthcare Management Workflow Diagrams
Healthcare Management Workflow Diagrams solution contains large set of colorful samples and libraries with predesigned vector pictograms and symbols of health, healthcare equipment, medical instruments, pharmaceutical tools, transport, medication, departments of healthcare organizations, the medical icons of people and human anatomy, as well as the predesigned flowchart objects, connectors and arrows, which make it the best for designing clear and comprehensive Medi?al Workflow Diagrams and Block Diagrams, Healthcare Management Flowcharts and Infographics, Healthcare Workflow Diagram, for depicting the healthcare workflow and clinical workflows in healthcare, for making the workflow analysis healthcare and healthcare workflow management.
UML Diagram

 Object-Role Modeling (ORM) Diagrams
Object-role Modeling (ORM) Diagram solution with powerful vector diagramming and data modeling tools, large quantity of specially developed samples and examples, and rich variety of vector objects corresponding to common ORM notation, ideally suits for developing the comprehensive, clear and visual Object-role Modeling (ORM) diagrams and schematics, understandable for all interested people from the different fields and business directions, for designing the ORM models, and demonstrating advantages from the use of ORM and its notation. It is intended for software developers and computer engineers, specialists in a field of Object-oriented programming (OOP), database architects, web-application constructors and developers, etc.
 Basic Circle-Spoke Diagrams
Basic circle-spoke diagrams are well suited for marketing, management documents, and presentations.
- Free Body Diagram Drawing Software
- Rapid UML | Sales Flowcharts | Define Free Body Diagram
- Draw Free Body Diagram Online
- Physics Diagrams | Free - body diagram | Functional Flow Block ...
- Free - body diagram | How to Draw Physics Diagrams in ...
- Free Body Diagram
- Biology Drawing Software | Physics Diagrams | Chemistry Drawing ...
- Drawing Free Body Diagrams
- The Example Of Planes As Diagrams