"In mathematics, the Euclidean algorithm, or Euclid's algorithm, is a method for computing the greatest common divisor (GCD) of two (usually positive) integers, also known as the greatest common factor (GCF) or highest common factor (HCF). ...
The GCD of two positive integers is the largest integer that divides both of them without leaving a remainder (the GCD of two integers in general is defined in a more subtle way).
In its simplest form, Euclid's algorithm starts with a pair of positive integers, and forms a new pair that consists of the smaller number and the difference between the larger and smaller numbers. The process repeats until the numbers in the pair are equal. That number then is the greatest common divisor of the original pair of integers.
The main principle is that the GCD does not change if the smaller number is subtracted from the larger number. ... Since the larger of the two numbers is reduced, repeating this process gives successively smaller numbers, so this repetition will necessarily stop sooner or later - when the numbers are equal (if the process is attempted once more, one of the numbers will become 0)." [Euclidean algorithm. Wikipedia]
The flowchart example "Euclidean algorithm" was created using the ConceptDraw PRO diagramming and vector drawing software extended with the Mathematics solution from the Science and Education area of ConceptDraw Solution Park.
HelpDesk
How to Create Flowchart Using Standard Flowchart Symbols
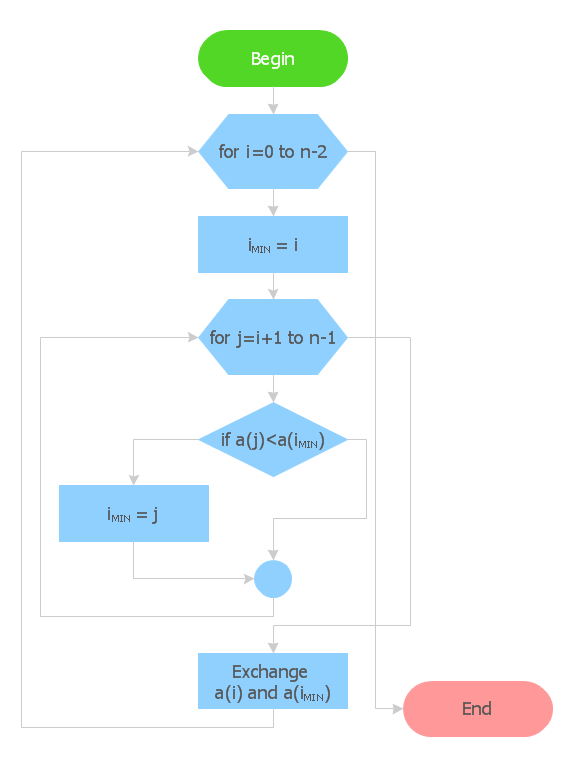
Flowcharts are used to display an algorithm for consistent execution of certain steps. Flowchart is probably the easiest way to make a graphical representation of any process. Flowcharts use the set of standard geometric symbols and arrows to define relationships. ConceptDraw PRO allows you to create professional flowchart quickly and easily. The ability to create flowcharts is contained in the Flowcharts solution. The solution provides a set of special tools for creating flowcharts.HelpDesk
How to Create a Cross - Functional Flowchart Using ConceptDraw PRO
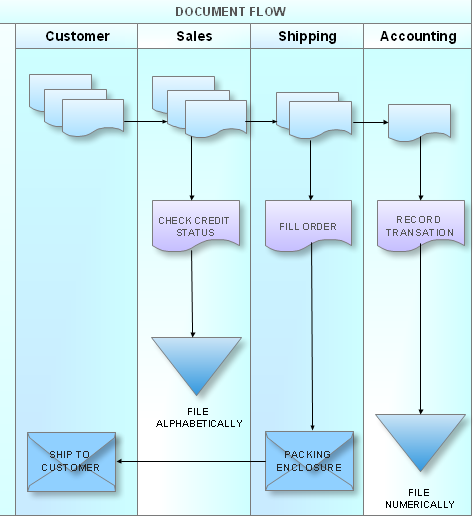
Cross-functional flowcharts are used to visualize cross-functional processes. Cross-functional process is a process that involves multiple divisions, each of which makes its part of the entire company workflow. For example: product development, lead management , client orders processing – and other critical processes. All of them are important both for business and customers, but the workflow and responsibilities distribution within these processes are divided between multiple departments and services. Cross-functional processes cannot be depicted with simple workflow diagrams, because of the specific interactions between company departments. ConceptDraw PRO has released the specialized solution to create cross-functional diagrams. Cross Functional Flowcharts solution includes a special set of templates and libraries to depict the cross-functional processes.
HelpDesk
How to Create an Accounting Flowchart Using ConceptDraw Solution Park
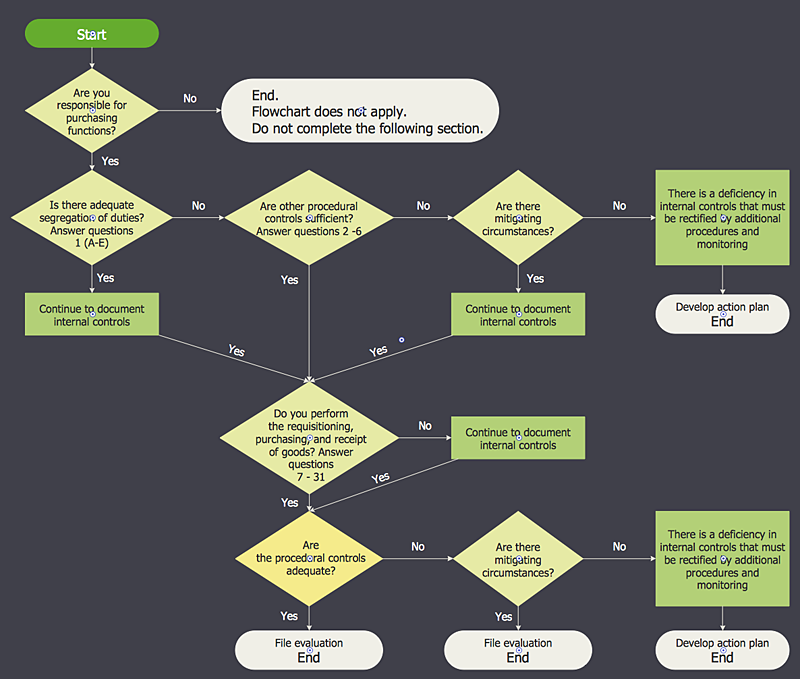
An Accounting flowchart is a specialized type of flowchart. With the help of an accounting flowchart you can visually describe tasks, documents, people responsible for execution at each stage of accounting workflow. Find out how you can easily create an accounting flowchart of any complexity using Accounting Flowchart Solution from the ConceptDraw Solution Park.- Euclidean algorithm - Flowchart | Basic Flowchart Symbols and ...
- Basic Flowchart Symbols and Meaning | Euclidean algorithm ...
- Solving quadratic equation algorithm - Flowchart | How To Create ...
- Solving quadratic equation algorithm - Flowchart | Basic Flowchart ...
- How To Make A Algorithm Flowchart
- Solving quadratic equation algorithm - Flowchart | Mathematics ...
- Flowchart Software | Create Flow Chart on Mac | Process Flow app ...
- Algorithm flowchart - Selection sorting method | Diagram Flow Chart ...
- Euclidean algorithm - Flowchart | Solving quadratic equation ...
- How To Make Flowchart In Elementary Algorithms
- Basic Flowchart Symbols and Meaning | Process Flowchart | Create ...
- Basic Flowchart Symbols and Meaning | Euclidean algorithm ...
- Euclidean algorithm - Flowchart | How To Make A Flowchart On ...
- Solving quadratic equation algorithm - Flowchart | Bar Diagrams for ...
- Euclidean algorithm - Flowchart | Basic Flowchart Symbols and ...
- Flow Chart Design - How to Design a Good Flowchart | Process ...
- How To Draw Example 7 Of Algorithm Flowchart
- Euclidean algorithm - Flowchart | Flow chart Example. Warehouse ...
- Euclidean algorithm - Flowchart | Types of Flowcharts | Basic ...
- Bio Flowchart Lite | Solving quadratic equation algorithm - Flowchart ...


