HelpDesk
How to Create a Bar Chart in ConceptDraw PRO

HelpDesk
How to Draw a Line Chart Quickly

Cross-Functional Flowcharts in ConceptDraw

Create Sophisticated Professional Diagrams - Simply

The vector stencils library "Cross-functional flowcharts" contains 31 flow chart symbols. Use it for drawing cross-functional and deployment flowcharts the ConceptDraw PRO diagramming and vector drawing software extended with the Cross-Functional Flowcharts solution from the Business Processes area of ConceptDraw Solution Park.
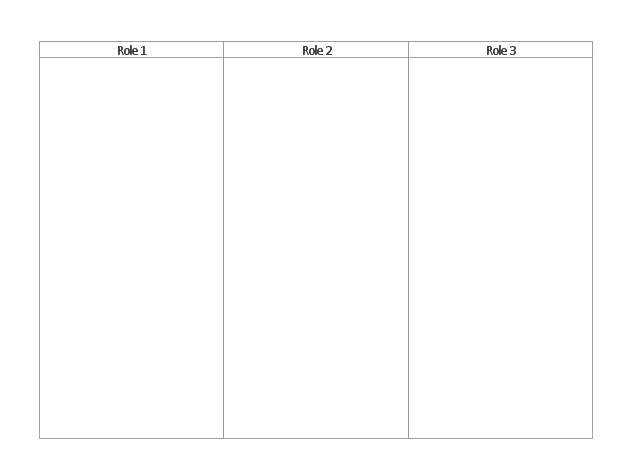
Swimlanes Vertical
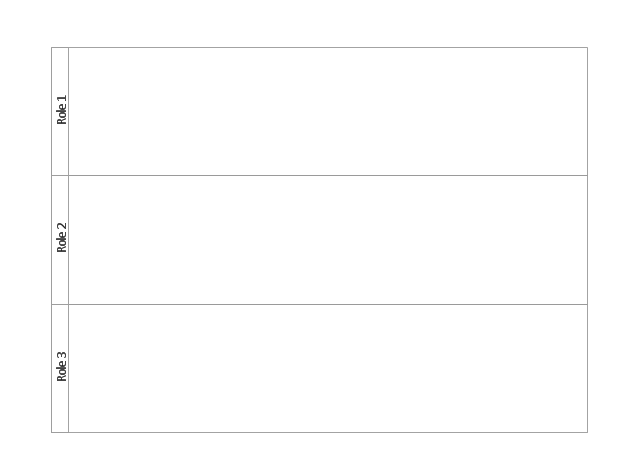
Swimlanes Horizontal
Terminator

Process

Decision

Yes
No
YES/NO
Data

Manual Operation

Document

Predefined Process

Stored Data

Internal Storage
Sequential Data

Direct Data
Manual Input

Card

Paper Tape

Display
Preparation

Parallel Mode

Loop limit

On-page Reference

Off-Page Reference (Outgoing)
-cross-functional-flowcharts---vector-stencils-library.png--diagram-flowchart-example.png)
Off-Page Reference (Incoming)
-cross-functional-flowcharts---vector-stencils-library.png--diagram-flowchart-example.png)
Off-page Reference (Circle)
-cross-functional-flowcharts---vector-stencils-library.png--diagram-flowchart-example.png)
Off-Page Reference (Arrow)
-cross-functional-flowcharts---vector-stencils-library.png--diagram-flowchart-example.png)
Annotation
Control Transfer
Condition
"Trade, also called goods exchange economy, is to transfer the ownership of goods from one person or entity to another by getting something in exchange from the buyer. Trade is sometimes loosely called commerce or financial transaction or barter. A network that allows trade is called a market. ...
Modern traders ... generally negotiate through a medium of exchange, such as money. As a result, buying can be separated from selling, or earning. ...
Retail trade consists of the sale of goods or merchandise from a very fixed location, such as a department store, boutique or kiosk, or by mail, in small or individual lots for direct consumption by the purchaser. Wholesale trade is defined as the sale of goods that are sold merchandise to retailers, to industrial, commercial, institutional, or other professional business users, or to other wholesalers and related subordinated services." [Trade. Wikipedia]
The deployment flow chart example "Trading process diagram" was created using the ConceptDraw PRO diagramming and vector drawing software extended with the Cross-Functional Flowcharts solution from the Business Processes area of ConceptDraw Solution Park.
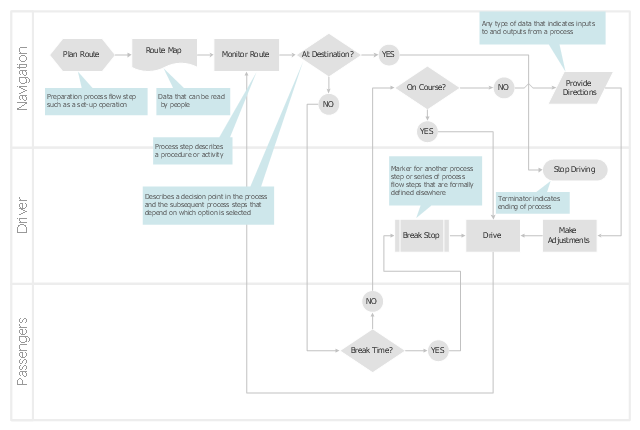
Deployment flowchart
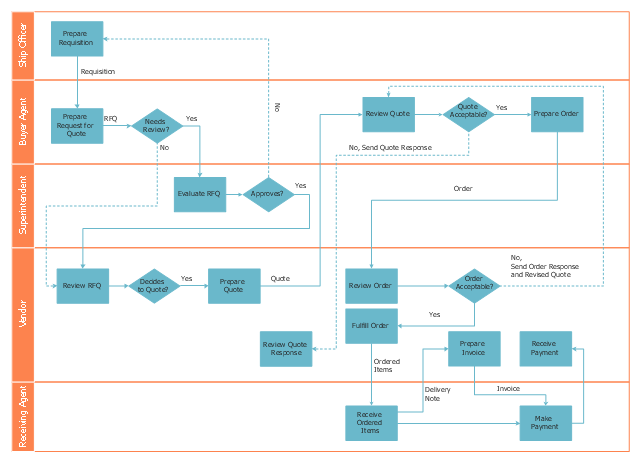
Cross-Functional (Deployment) Flowcharts visualize what functional units (people, departments or functional areas) are responsible for the business process operations. The flowcharts are divided into rows/ columns of functional units. Blocks of various shapes represent the process steps, and are placed in rows/ columns of the responsible functional units. These flowcharts are used to display the relationships of processes and responsible functional units.
The cross-functional horizontal flowchart template for the ConceptDraw PRO diagramming and vector drawing software is included in the Cross-Functional Flowcharts solution from the Business Processes area of ConceptDraw Solution Park.
The cross-functional horizontal flowchart template for the ConceptDraw PRO diagramming and vector drawing software is included in the Cross-Functional Flowcharts solution from the Business Processes area of ConceptDraw Solution Park.
Cross-functional flowchart template
 Football
The Football Solution extends ConceptDraw PRO v9.5 (or later) software with samples, templates, and libraries of vector objects for drawing football (American) diagrams, plays schemas, and illustrations. It can be used to make professional looking documen
- Cross-Functional Flowchart | Cross-functional horizontal flowchart ...
- Horizontal Flowchart | Cross-functional horizontal flowchart ...
- Drawing Software Horizontal Cross Functional Flowchart
- Trading process diagram - Deployment flowchart | Vertical Cross ...
- Trading process diagram - Deployment flowchart | Cross-Functional ...
- Cross-Functional Flowchart | UML Deployment Diagram ...
- Horizontal Flowchart | Cross-Functional Flowchart | Cross-functional ...
- A Functional Deployment Process Diagram
- Trading process diagram - Deployment flowchart | UML Deployment ...
- Swimlanes - Vector stencils library | Swimlanes BPMN 1.2 - Vector ...
- Cross Functional Horizontal
- UML Deployment Diagram Example - ATM System UML diagrams ...
- Flow Chart Creator | Settlement Process Flowchart. Flowchart ...
- Swim Lane Diagrams | Cross-Functional Flowchart | Swim Lanes ...
- Flowchart Software For Horizontal Cross Functional Flowchart
- Deployment flowchart
- Deployment Flowchart Example
- Cross-Functional Flowchart (Swim Lanes) | Swim Lane Diagrams ...
- Cross-Functional Flowchart (Swim Lanes) | Cross-Functional ...
- Trading process diagram - Deployment flowchart | Cross-Functional ...