 Quality
This solution extends ConceptDraw PRO v9 and ConceptDraw MINDMAP v7 with Quality Management Diagrams (Total Quality Management Diagrams, Timelines, Workflows, Value Stream Maps) and Mind Maps (Presentations, Meeting Agendas, Problem to be solved).
HelpDesk
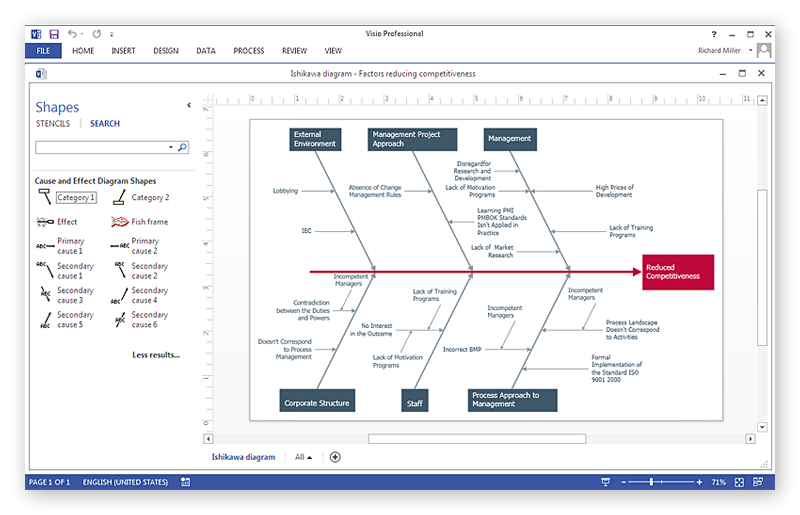
How To Create a MS Visio Cause and Effect Diagram Using ConceptDraw PRO
Cause-and-Effect Ishikawa Diagram is a graphical method of analysis and cause-effect relationships, a tool in the form of fish bone. It is used to systematically determine the cause of the problem and represent it graphically. The technique is primarily used in the framework of quality management for the analysis of quality problems and their causes. Nowadays, it has found worldwide distribution and is used in multiple problem areas. It is one of the tools of lean manufacturing, which is used in group work to find the problems and their causes. ConceptDraw PRO allows you to easily create Fishbone (Ishikawa) diagram and then make a MS Visio VSDX, or VSD files from your diagrams in a couple clicks, using the export capabilities of ConcewptDraw PRO.HelpDesk
How to Track Your Project Plan vs. the Actual Project Condition
Conceptdraw PROJECT provides user with the possibility to track how the project is going. Project Manager can compare the actual data with the planned and assess possible measures to resolve issues. Conceptdraw PROJECT has several types of visual reports that can help to assess visually the difference between planned and actual project data.Project — Working With Tasks
A full-featured project management solution with all the necessary functions right at your fingertips. Generates an extensive variety of reports on project and task statuses. These videos provide a series of lessons that will enhance the understanding of all our users, from people just starting out with the software, through to expert users.
 Project Exchange
This solution extends ConceptDraw PROJECT and ConceptDraw MINDMAP software with the ability to import and export project data.
HelpDesk
How to Draw a Gantt Chart Using ConceptDraw PRO
A Gantt chart is intended to provide a visualization of a project schedule. It is developed to help planning, coordinating, and tracking on project tasks implementation. One of the most critical resources for a project implementation is a time resources. Gantt chart - is one of the most convenient and popular way of graphical representation of a project tasks progress in conjunction with the corresponding time consumption. Gantt chart's function is to show project tasks completion in a progress, and to make a project manager sure that project tasks were completed on time. ConceptDraw Office is a clear and easy-to-use tool for project management. It is a very handy visual tool that helps make a project processing clear.- How to Identify Project Milestones | How to Create a Timeline ...
- Timeline Examples | Project Timeline | How to Make a Timeline ...
- How to Create a Timeline Diagram in ConceptDraw PRO | How to ...
- Project Timeline | Timeline Examples | How to Make a Timeline ...
- How to Make a Timeline | Timeline Diagrams | Project Timeline ...
- Timeline Examples | Project Timeline | How to Make a Timeline ...
- Difference Between Timeline And Gantt Chart
- How to Make a Timeline | Project Timeline | Timeline Diagrams ...
- Timeline Examples | How to Make a Timeline | Project Timeline ...
- How to Make a Timeline | How to Create a Timeline Diagram in ...
- How to Make a Timeline | Project Timeline | Timeline Examples ...
- How to Make a Timeline | Business Process Mapping — How to Map ...
- How to Create a Timeline Diagram in ConceptDraw PRO | Project ...
- How to Create a Timeline Diagram in ConceptDraw PRO | Design ...
- Timeline Examples | How to Make a Timeline | Timeline Diagrams ...
- Project Timeline | Timeline Diagrams | How to Create a Timeline ...
- How to Report Task's Execution with Gantt Chart | How to Make a ...
- How to Create a Timeline Diagram in ConceptDraw PRO | Timeline ...
- How to Make a Timeline | Project timeline diagram - New business ...


