HelpDesk
How to Make a Mind Map from a Project Gantt Chart
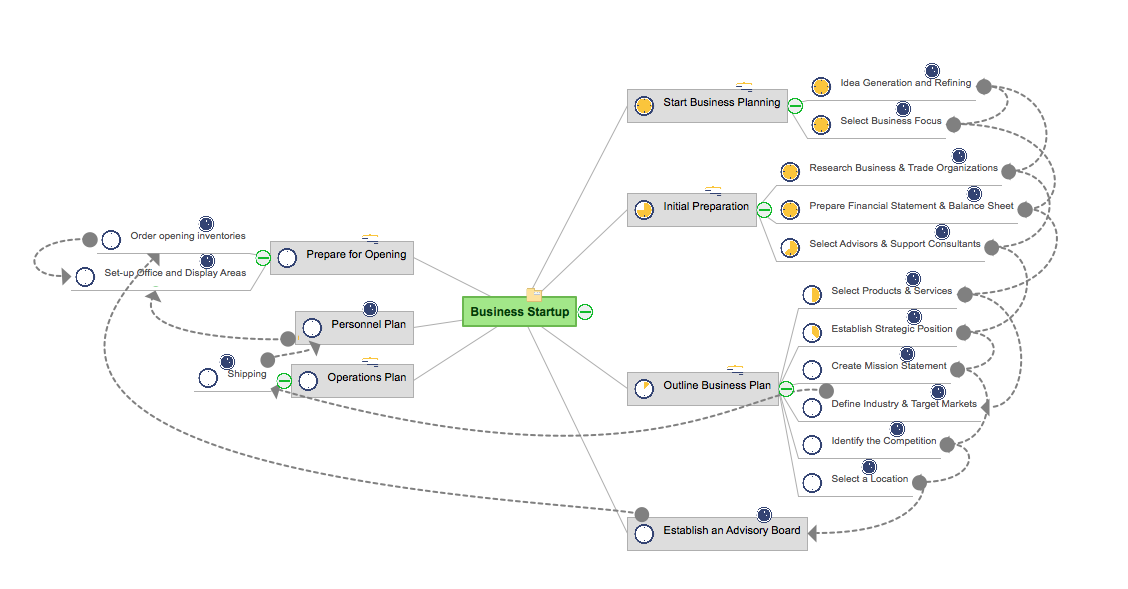
ConceptDraw Office allows you to see the project data from ConceptDraw PROJECT in a mind map structure by opening your project in ConceptDraw MINDMAP.What is Gantt Chart (historical reference)
Historical reference about the Gantt chart.HelpDesk
How to Create a Gantt Chart for Your Project
Instruction on how to create Gantt chart using ConceptDraw PROJECT software. Gant Chart is a graphical representation of tasks as segments on a time scale. It helps plan or overlapping.HelpDesk
How to Draw a Gantt Chart Using ConceptDraw PRO
A Gantt chart is intended to provide a visualization of a project schedule. It is developed to help planning, coordinating, and tracking on project tasks implementation. One of the most critical resources for a project implementation is a time resources. Gantt chart - is one of the most convenient and popular way of graphical representation of a project tasks progress in conjunction with the corresponding time consumption. Gantt chart's function is to show project tasks completion in a progress, and to make a project manager sure that project tasks were completed on time. ConceptDraw Office is a clear and easy-to-use tool for project management. It is a very handy visual tool that helps make a project processing clear.- Online Gantt Chart Free
- Free Pert Chart Osx
- Free Online Flow Chart Maker
- Make A Chart Online Free
- Free Online Charts
- Free Gantt Chart For Mac
- Online Free Chart Maker
- Free Online Chart
- Free Online Workflow Diagram
- Project Timeline | Gant Chart in Project Management | How to ...
- Chart Free Online
- How to Make a Mind Map from a Project Gantt Chart | Business ...
- Make Charts Online Free
- Free Online Chart Creator
- Free Gantt Chart Template Download
- Make Chart Online Free
- Create A Chart Online Free
- Gantt Chart Free Template Download
- Free Gantt Chart Tool
- Free Gantt Chart Creator


