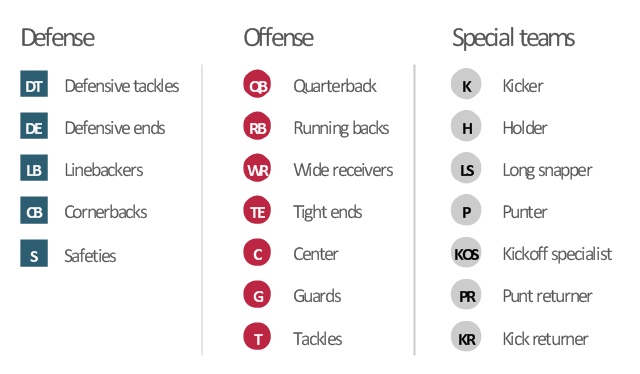
The vector stencils library "American football positions" contains 38 symbols for drawing diagrams of American football positions.
"A football game is played between two teams of 11 players each. It is legal to have fewer players on the field, but playing with more on the field is punishable by a penalty. Teams may substitute any number of their players between downs; this "platoon" system replaced the original system, which featured limited substitution rules, and has resulted in teams utilizing specialized offensive, defensive and special teams squads.
Individual players in a football game must be designated with a uniform number between 1 and 99. NFL teams are required to number their players by a league-approved numbering system, and any exceptions must be approved by the Commissioner. NCAA and NFHS teams are "strongly advised" to number their offensive players according to a league-suggested numbering scheme." [American football. Wikipedia]
The symbols example "Design elements - Football positions" was created using the ConceptDraw PRO diagramming and vector drawing software extended with the Football solution from the Sport area of ConceptDraw Solution Park.
American football positions diagram symbols
 Business Package for Management
Package intended for professional who designing and documenting business processes, preparing business reports, plan projects and manage projects, manage organizational changes, prepare operational instructions, supervising specific department of an organization, workout customer service processes and prepare trainings for customer service personal, carry out a variety of duties to organize business workflow.
How to Construct a Fishbone Diagram

 Australia Map
For graphic artists creating accurate maps of Australia. The Australia Map solution - allows designers to map Australia for their needs, offers a collection of scalable graphics representing the political geography of Australia, split into distinct state
 Continent Maps
Continent Maps solution extends ConceptDraw PRO software with templates, samples and libraries of vector stencils for drawing the thematic maps of continents, state maps of USA and Australia.
- Number Of Players On The Football Field And Position S
- 11 Players Diagram Of Football Positions
- Association football (soccer) positions | Basketball Court Diagram ...
- Football Pitch Diagram And Numbers That Represent Position
- Number Symbol For Football Player
- Football Field Position Numbers
- Football Game Diagram With Player
- Soccer ( Football ) Positions | How to Make Soccer Position Diagram ...
- Football Field With Player Numbers
- Where American Football Players Play Diagram
- Baseball Diagram – Defence Positions | Design elements - Football ...
- Design elements - Football positions | Diagram Of A Fooball Field ...
- Design elements - Football positions | Football Field Numbering ...
- A Diagram Of Players Position In Football And Their Position
- Diagram Of Football Player And Their Position And The Number
- Diagram Of Football Feed An Position Of Players From 1 To 11
- Design elements - Football positions
- Association football (soccer) positions | Soccer ( Football ) Formation ...
- Football Positions Number Diagrams
- Football Field And Players Number