 Pie Charts
Pie Charts are extensively used in statistics and business for explaining data and work results, in mass media for comparison (i.e. to visualize the percentage for the parts of one total), and in many other fields. The Pie Charts solution for ConceptDraw DIAGRAM offers powerful drawing tools, varied templates, samples, and a library of vector stencils for simple construction and design of Pie Charts, Donut Chart, and Pie Graph Worksheets.
Pie Chart Software

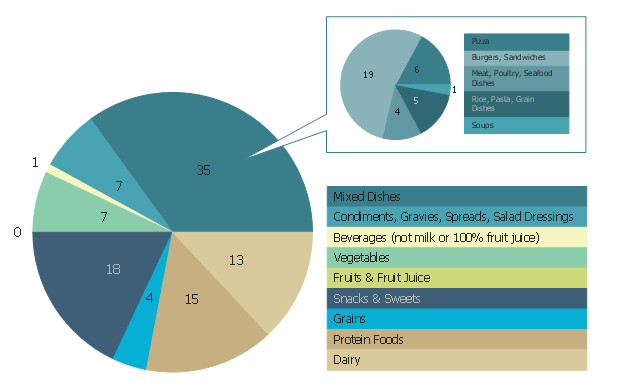
This pie chart sample shows the percentage of saturated fats in the U.S. population diet. It was designed on the base of figure 2-12. "Food Category Sources of Saturated Fats in the U.S. Population Ages 2 Years and Older" on the webpage "A Closer Look at Current Intakes and Recommended Shifts" from the website of the U.S. Office of Disease Prevention and Health Promotion (ODPHP).
"The mixed dishes food category is the major source of saturated fats in the United States (Figure 2-12), with 35 percent of all saturated fats coming from mixed dishes, especially those dishes containing cheese, meat, or both. These include burgers, sandwiches, and tacos; pizza; rice, pasta, and grain dishes; and meat, poultry, and seafood dishes. The other food categories that provide the most saturated fats in current diets are snacks and sweets, protein foods, and dairy products." [health.gov/ dietaryguidelines/ 2015/ guidelines/ chapter-2/ a-closer-look-at-current-intakes-and-recommended-shifts/ ]
The pie chart example "Saturated fats in the U.S. population diet" was created using the ConceptDraw PRO diagramming and vector drawing software extended with the Pie Charts solutiton of the Graphs and Charts area in ConceptDraw Solution Park.
Pie chart
Percentage Spider Chart

The vector stencils library "Pie charts" contains 30 templates of pie and donut (doughnut, ring) charts for visualizing percentage for parts of one total, or compare parts of few totals.
Drag a template from the library into your document and enter your data.
Use these shapes to draw your pie charts and donut charts in the ConceptDraw PRO diagramming and vector drawing software.
The vector stencils library "Pie charts" is included in the Pie Charts solution of the Graphs and Charts area in ConceptDraw Solution Park.
Pie chart (table)
-pie-charts---vector-stencils-library.png--diagram-flowchart-example.png)
Pie chart

Percentage pie chart

Pie chart, control dots

Separated pie chart

Percentage separated pie chart

Pie chart with shifted slices

Percentage pie chart with shifted slices

Ring chart (table)
-pie-charts---vector-stencils-library.png--diagram-flowchart-example.png)
Ring chart

Percentage ring chart

Ring chart 2

Percentage ring chart 2

Ring chart, control dots

Arrow ring chart
Percentage arrow ring chart
Pie chart (light)
-pie-charts---vector-stencils-library.png--diagram-flowchart-example.png)
Percentage pie chart (light)
-pie-charts---vector-stencils-library.png--diagram-flowchart-example.png)
Pie chart (light), control dots
,-control-dots-pie-charts---vector-stencils-library.png--diagram-flowchart-example.png)
Separated pie chart (light)
-pie-charts---vector-stencils-library.png--diagram-flowchart-example.png)
Percentage separated pie chart (light)
-pie-charts---vector-stencils-library.png--diagram-flowchart-example.png)
Pie chart with shifted slices (light)
-pie-charts---vector-stencils-library.png--diagram-flowchart-example.png)
Percentage pie chart with shifted slices (light)
-pie-charts---vector-stencils-library.png--diagram-flowchart-example.png)
Ring chart (light)
-pie-charts---vector-stencils-library.png--diagram-flowchart-example.png)
Percentage ring chart (light)
-pie-charts---vector-stencils-library.png--diagram-flowchart-example.png)
Ring chart (light) 2
-2-pie-charts---vector-stencils-library.png--diagram-flowchart-example.png)
Percentage ring chart (light) 2
-2-pie-charts---vector-stencils-library.png--diagram-flowchart-example.png)
Ring chart (light), control dots
,-control-dots-pie-charts---vector-stencils-library.png--diagram-flowchart-example.png)
Arrow ring chart (light)
Percentage arrow ring chart (light)
 Composition Dashboard
Composition dashboard solution extends ConceptDraw DIAGRAM software with templates, samples and vector stencils library with charts and indicators for drawing visual dashboards showing data composition.
Chart Templates

Business Report Pie. Pie Chart Examples

 Basic Pie Charts
This solution extends the capabilities of ConceptDraw DIAGRAM (or later) with templates, samples, and a library of vector stencils for drawing pie and donut charts.
Chart Examples

- Bar Charts And Pie Charts On Food Security In India
- Food Court | Bar Graphs | Pie Charts | Food Security In India With ...
- Pie Charts | Food Court | Picture Graph | Indian Resources Pie Chart
- Health Food | HR arrows - Vector stencils library | Design elements ...
- Bar Graphs | Food Court | Pie Charts | Bar Graph On Food Security ...
- Economic sector weightings | Opportunities in agro and food ...
- Percentage Pie Chart . Pie Chart Examples | Percentage of the top 1 ...
- How to Draw a Pie Chart Using ConceptDraw PRO | Pie Chart ...
- Area Charts | Pie Charts Of Agriculture In India
- Opportunities in agro and food processing sector in Punjab | Sectors ...