Energy Pyramid Diagram

 Pie Charts
Pie Charts are extensively used in statistics and business for explaining data and work results, in mass media for comparison (i.e. to visualize the percentage for the parts of one total), and in many other fields. The Pie Charts solution for ConceptDraw PRO v10 offers powerful drawing tools, varied templates, samples, and a library of vector stencils for simple construction and design of Pie Charts, Donut Chart, and Pie Graph Worksheets.
 Bubble Diagrams
Bubble diagrams have enjoyed great success in software engineering, architecture, economics, medicine, landscape design, scientific and educational process, for ideas organization during brainstorming, for making business illustrations, presentations, planning, design, and strategy development. They are popular because of their simplicity and their powerful visual communication attributes.
Diagram of a Pyramid

 Target and Circular Diagrams
This solution extends ConceptDraw PRO software with samples, templates and library of design elements for drawing the Target and Circular Diagrams.
Pyramid Charts

 Divided Bar Diagrams
The Divided Bar Diagrams Solution extends the capabilities of ConceptDraw PRO v10 with templates, samples, and a library of vector stencils for drawing high impact and professional Divided Bar Diagrams and Graphs, Bar Diagram Math, and Stacked Graph.
 25 Typical Orgcharts
The 25 Typical Orgcharts solution contains powerful organizational structure and organizational management drawing tools, a variety of professionally designed organization chart and matrix organization structure samples, 25 templates based on various orga
Types of Flowcharts


Rack Diagrams


 Picture Graphs
Typically, a Picture Graph has very broad usage. They many times used successfully in marketing, management, and manufacturing. The Picture Graphs Solution extends the capabilities of ConceptDraw PRO v10 with templates, samples, and a library of professionally developed vector stencils for designing Picture Graphs.
 Manufacturing and Maintenance
Manufacturing and maintenance solution extends ConceptDraw PRO software with illustration samples, templates and vector stencils libraries with clip art of packaging systems, industrial vehicles, tools, resources and energy.
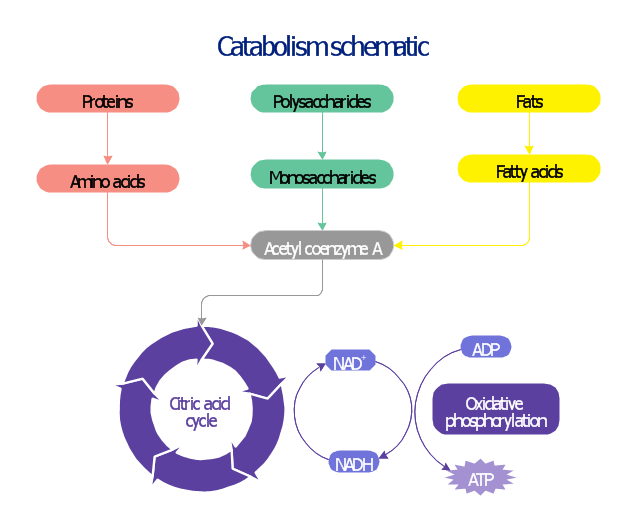
This biochemical chart display how proteins, polysaccharides and fats from food are digested into gastrointestinal tract into aminoacids, monosaccharides and fatty acids, and then broken down and oxidized to carbon dioxide and water in cellular processes of energy generation.
This metabolic pathway map was redesigned from Wikipedia file: Catabolism schematic.svg. [en.wikipedia.org/ wiki/ File:Catabolism_ schematic.svg]
The biochemical diagram example "Catabolism schematic" was created using the ConceptDraw PRO diagramming and vector drawing software extended with the Biology solution from the Science and Education area of ConceptDraw Solution Park.
Catabolic pathway map
- Energy Pyramid Diagram | Pie Charts | Manufacturing and ...
- Design elements - Food | Energy Pyramid Diagram | Fast food ...
- Energy Pyramid Diagram | Fast food restaurant menu prices ...
- Healthy Foods | Energy Pyramid Diagram | Ecosystem goods and ...
- Energy Food Pic Diagrams
- Energy Pyramid Diagram | Fast food restaurant menu prices ...
- Pyramid Chart Examples | Energy Pyramid Diagram | Diagram of a ...
- Pyramid Chart Examples | Energy Pyramid Diagram | Diagram of a ...
- Energy Pyramid Diagram | Diagram of a Pyramid | Pyramid Charts ...
- Energy Pyramid Diagram | Pyramid Chart Maker | Pyramid Charts ...
- Pyramid Chart Examples | Pyramid Charts | Energy Pyramid ...
- Pyramid Chart Maker | Pyramid Charts | Energy Pyramid Diagram ...
- Energy Pyramid Diagram | Pyramid Charts | Diagram of a Pyramid ...
- Energy Pyramid Diagram | How to Create a Scatter Chart | U.S. ...
- Draw Fishbone Diagram on MAC Software | Food Court | Cafe and ...
- Energy Pyramid Diagram | Scatter Chart Examples | Chart Examples ...
- Energy Pyramid Diagram | Diagram of a Pyramid | Pyramid Charts ...
- Pyramid Chart Examples | Energy Pyramid Diagram | Diagram of a ...
- Pyramid Diagram and Pyramid Chart
- Energy Pyramid Diagram | Chemical Engineering | Diagram of a ...