Account FlowchartFlowchart Examples

Settlement Process Flowchart. Flowchart Examples

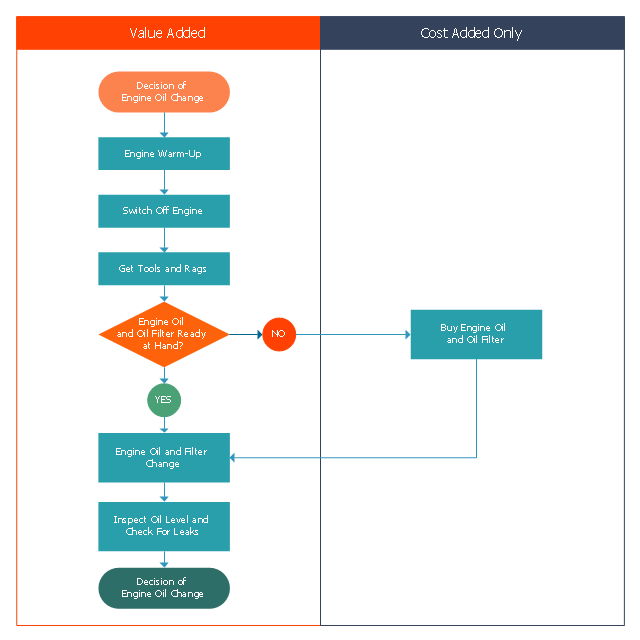
This opportunity flowchart sample shows the steps involved in replacing engine oil process. The opportunity flowcharts are used in business process improvement to identify process steps which might be improved.
"Business process improvement (BPI) is a systematic approach to help an organization optimize its underlying processes to achieve more efficient results. ...
An organization is only as good as its processes. To be able to make the necessary changes in an organization, one needs to understand the key processes of the company. Rummler and Brache suggested a model for running a Process Improvement and Management project (PI&M), containing the following steps:
1. Identify the process to be improved (based on a critical business issue): The identification of key processes can be a formal or informal exercise. The management team might select processes by applying a set of criteria derived from strategic and tactical priorities, or process selection is based on obvious performance gaps. It is important is to select the process(es) which have the greatest impact on a competitive advantage or customer requirement.
2. Develop the objective(s) for the project based on the requirements of the process: The focus might be on quality improvement, productivity, cost, customer service or cycle time. The goal is however always the same; to get the key process under control.
3. Select the members of the cross-functional team: A horizontal (cross-functional) analysis is carried out by a team composed of representatives of all functions involved in the process. While a consultant or in-house staff person can do the job, the quality of the analysis and the commitment to change is far greater with a cross-functional team.
4. Document the current process by creating a flowchart or "organization map": Describe the process regarding the Organizational level, the Process level and the Job/ Performer level according to Rummler. Develop a cross-functional process map for the process.
5. Identify "disconnects" in the process: “Disconnections” are everything that inhibit the efficiency and effectiveness of the process. The identification should be categorized into the three levels: The Organizational level, the Process level and the Job/ Performer level.
6. Recommend changes (organizational, in the process or in its execution): Categorize and prioritize the main problems and possibilities, evaluate alternative solutions. Develop a cross-functional process map for the recommended process.
7. Establish process and sub-process measures: The process measures should reflect the objectives of the project.
8. Implement the improvements." [Business process improvement. Wikipedia]
The swim lane diagram example "Opportunity flowchart - Replacing engine oil" was created using the ConceptDraw PRO diagramming and vector drawing software extended with the Cross-Functional Flowcharts solution from the Business Processes area of ConceptDraw Solution Park.
Swim lane diagram
Types of Welding in Flowchart

Create Flowchart - Making a Flowchart

Definition Flowchart

Diagram Flow Chart

Create Process Flowcharts

Draw Flowcharts with ConceptDraw

Bar Diagrams for Problem Solving. Create manufacturing and economics bar charts with Bar Graphs Solution

"Project planning is part of project management, which relates to the use of schedules such as Gantt charts to plan and subsequently report progress within the project environment.
Initially, the project scope is defined and the appropriate methods for completing the project are determined. Following this step, the durations for the various tasks necessary to complete the work are listed and grouped into a work breakdown structure. Project planning is often used to organize different areas of a project, including project plans, work loads and the management of teams and individuals. The logical dependencies between tasks are defined using an activity network diagram that enables identification of the critical path. Float or slack time in the schedule can be calculated using project management software. Then the necessary resources can be estimated and costs for each activity can be allocated to each resource, giving the total project cost. At this stage, the project schedule may be optimized to achieve the appropriate balance between resource usage and project duration to comply with the project objectives. Once established and agreed, the project schedule becomes what is known as the baseline schedule. Progress will be measured against the baseline schedule throughout the life of the project. Analyzing progress compared to the baseline schedule is known as earned value management.
The inputs of the project planning phase include the project charter and the concept proposal. The outputs of the project planning phase include the project requirements, the project schedule, and the project management plan." [Project planning. Wikipedia]
The flow chart example "Project planning process" was created using the ConceptDraw PRO diagramming and vector drawing software extended with the Flowcharts solution from the area "What is a Diagram" of ConceptDraw Solution Park.
Flowchart - Project planning process

Sample Project Flowchart. Flowchart Examples


Process Engineering

Use the Best FlowChart Tool for the Job

Baseball Field Schema

The vector stencils library "Flowchart" contains 26 symbols for drawing the flow charts using the ConceptDraw PRO diagramming and vector drawing software.
"Flowcharts are used in designing and documenting complex processes or programs. Like other types of diagrams, they help visualize what is going on and thereby help the viewer to understand a process, and perhaps also find flaws, bottlenecks, and other less-obvious features within it. There are many different types of flowcharts, and each type has its own repertoire of boxes and notational conventions. The two most common types of boxes in a flowchart are:
(1) a processing step, usually called activity, and denoted as a rectangular box;
(2) a decision, usually denoted as a diamond.
A flowchart is described as "cross-functional" when the page is divided into different swimlanes describing the control of different organizational units. A symbol appearing in a particular "lane" is within the control of that organizational unit. This technique allows the author to locate the responsibility for performing an action or making a decision correctly, showing the responsibility of each organizational unit for different parts of a single process. ...
Common alternate names include: flowchart, process flowchart, functional flowchart, process map, process chart, functional process chart, business process model, process model, process flow diagram, work flow diagram, business flow diagram. The terms "flowchart" and "flow chart" are used interchangeably." [Flowchart. Wikipedia]
The example "Design elements - Flowchart" is included in the Flowcharts solution from the area "What is a Diagram" of ConceptDraw Solution Park.
Flowchart notation

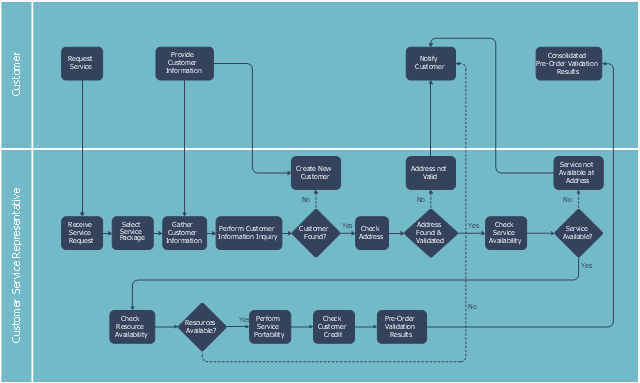
This swim lane diagram sample shows the telecom services process flow.
"Telecommunication is communication at a distance by technological means, particularly through electrical signals or electromagnetic waves. ...
Electrical and electromagnetic telecommunication technologies include telegraph, telephone, and teleprinter, networks, radio, microwave transmission, fiber optics, communications satellites and the Internet." [Telecommunication. Wikipedia]
"A telecommunications service provider or TSP is a type of communications service provider that has traditionally provided telephone and similar services. This category includes incumbent local exchange carriers, competitive local exchange carriers, and mobile wireless communication companies. ...
While some people use the terms "telecom service provider" and "communications service provider" interchangeably, the term TSP generally excludes Internet service providers (ISPs), cable companies, satellite TV, and managed service providers. ...
TSPs provide access to telephone and related communications services." [Telecommunications service provider. Wikipedia]
The cross-functional flowchart example "Providing telecom services" was created using the ConceptDraw PRO diagramming and vector drawing software extended with the Cross-Functional Flowcharts solution from the Business Processes area of ConceptDraw Solution Park.
Swin lane diagram
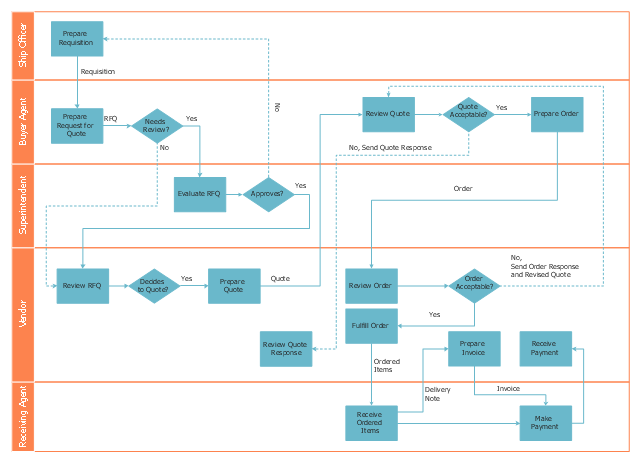
This deployment flow chart sample shows the trading process flow.
"Trade, also called goods exchange economy, is to transfer the ownership of goods from one person or entity to another by getting something in exchange from the buyer. Trade is sometimes loosely called commerce or financial transaction or barter. A network that allows trade is called a market. ...
Modern traders ... generally negotiate through a medium of exchange, such as money. As a result, buying can be separated from selling, or earning. ...
Retail trade consists of the sale of goods or merchandise from a very fixed location, such as a department store, boutique or kiosk, or by mail, in small or individual lots for direct consumption by the purchaser. Wholesale trade is defined as the sale of goods that are sold merchandise to retailers, to industrial, commercial, institutional, or other professional business users, or to other wholesalers and related subordinated services." [Trade. Wikipedia]
The swim lane diagram example "Deployment flowchart - Trading process diagram" was created using the ConceptDraw PRO diagramming and vector drawing software extended with the Cross-Functional Flowcharts solution from the Business Processes area of ConceptDraw Solution Park.
Swim lane diagram
Process Flow Diagrams

How To Make Histogram in ConceptDraw DIAGRAM ?

- Account Flowchart . Flowchart Examples - Process flowchart
- Design elements - Process flowchart | Design elements - Flowchart ...
- Design elements - Cross-functional flowcharts | Providing telecom ...
- Providing telecom services - Cross-functional flowchart | Solving ...
- Design elements - Process flowchart | Design elements - Sales ...
- Design elements - Process flowchart | Flowcharting Symbols Wiki
- Euclidean algorithm - Flowchart | Solving quadratic equation ...
- Design elements - Process flowchart | Flow Chart Symbols Wikipedia
- Event-driven Process Chain Diagrams | Business Process Wikipedia
- Providing telecom services - Cross-functional flowchart | Credit ...