Example of DFD for Online Store (Data Flow Diagram) DFD Example
Data Flow Diagram (DFD) is a methodology of graphical structural analysis and information systems design, which describes the sources external in respect to the system, recipients of data, logical functions, data flows and data stores that are accessed. DFDs allow to identify relationships between various system's components and are effectively used in business analysis and information systems analysis. They are useful for system’s high-level details modeling, to show how the input data are transformed to output results via the sequence of functional transformations. For description of DFD diagrams are uses two notations — Yourdon and Gane-Sarson, which differ in syntax. Online Store DFD example illustrates the Data Flow Diagram for online store, the interactions between Customers, Visitors, Sellers, depicts User databases and the flows of Website Information. ConceptDraw DIAGRAM enhanced with Data Flow Diagrams solution lets you to draw clear and simple example of DFD for Online Store using special libraries of predesigned DFD symbols.
 Flowcharts
The Flowcharts solution for ConceptDraw DIAGRAM is a comprehensive set of examples and samples in several varied color themes for professionals that need to represent graphically a process. Solution value is added by the basic flow chart template and shapes' libraries of flowchart notation. ConceptDraw DIAGRAM flow chart creator lets one depict the processes of any complexity and length, as well as design the Flowchart either vertically or horizontally.
 Marketing Diagrams
Marketing Diagrams solution extends ConceptDraw DIAGRAM diagramming software with abundance of samples, templates and vector design elements intended for easy graphical visualization and drawing different types of Marketing diagrams and graphs, including Branding Strategies Diagram, Five Forces Model Diagram, Decision Tree Diagram, Puzzle Diagram, Step Diagram, Process Chart, Strategy Map, Funnel Diagram, Value Chain Diagram, Ladder of Customer Loyalty Diagram, Leaky Bucket Diagram, Promotional Mix Diagram, Service-Goods Continuum Diagram, Six Markets Model Diagram, Sources of Customer Satisfaction Diagram, etc. Analyze effectively the marketing activity of your company and apply the optimal marketing methods with ConceptDraw DIAGRAM software.
 Genogram
Genogram solution including professionally designed genogram samples and a wide range of high-quality vector design elements of genogram symbols, medical genogram symbols, emotional relationships and family relationships, makes the ConceptDraw DIAGRAM software the best for drawing the informative Genograms, genealogy schematics and illustrations, and family tree of any depth, and for any quantity of generations. It perfectly suits for the medical specialists of different profiles, medical consultants, therapists, genetics, psychologists, and other medical professionals, each individual and couple.
Educational Technology Tools
What are the favorite educational technology tools and techniques for teachers? Of course these are pictures, images and education infographics! ConceptDraw DIAGRAM software supplied with Education Infographics Solution from the Business Infographics Area provides powerful drawing tools to help design the education infographics of any complexity.Biomedical Technology
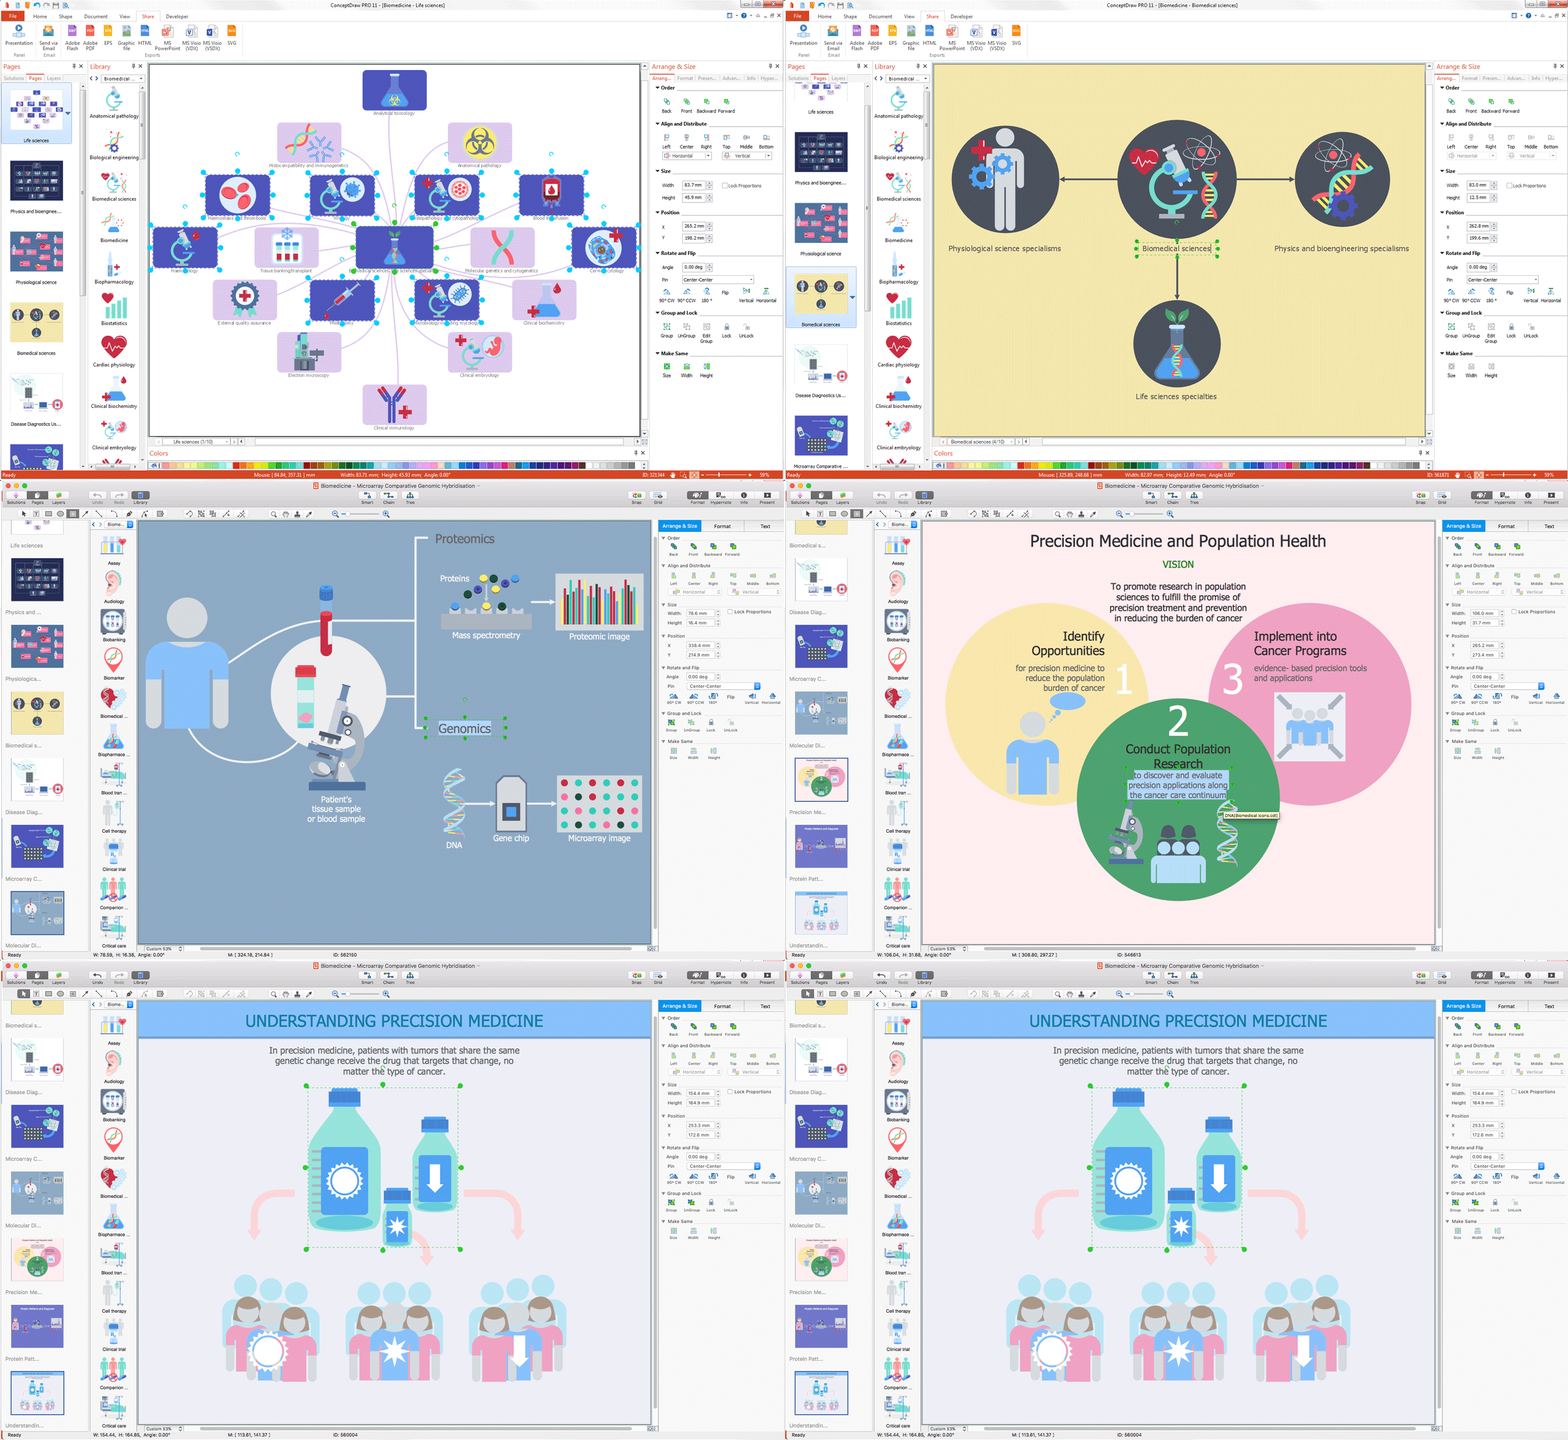
Talking about software, one of the best diagramming and drawing ones is ConceptDraw DIAGRAM nowadays. Having the mentioned tool anyone can create the needed drawings, including the biomedical ones, within a short period of time as long as the appropriate solution is downloaded and installed. Having the Biomedicine solution that extends the ConceptDraw DIAGRAM vector diagramming application with the pre-made samples and stencil libraries can help to complete the tasks on time even though you have no experience in making the needed illustrations.Choosing any needed from 137 vector graphics icons from the Biomedicine solution may simplify the work of creating the great looking as well as smart and professional looking drawings within only a few minutes. Being based on the already previously created examples of the biomedical-related drawings, any ConceptDraw DIAGRAM user can make the unique ones getting a smart looking result.
- Marketing Diagrams | Flow chart Example. Warehouse Flowchart ...
- Flow chart Example. Warehouse Flowchart | Bar Diagrams for ...
- Process Flowchart | Food security assessment - Flowchart | Step ...
- Food security assessment - Flowchart | Agriculture Flowchart Draw
- Bar Diagrams for Problem Solving. Create economics and financial ...
- Bar Diagrams for Problem Solving. Create economics and financial ...
- Example of DFD for Online Store (Data Flow Diagram ) DFD ...
- Area Charts | Cross Functional Flowchart Examples | Draw The ...
- Process Flowchart | Step chart - Value chain | Flow chart Example ...
- Flow Chart Showing Agriculture Practice


