This interactive voice response (IVR) flowchart sample shows the store reporting process flow.
"Call centers use IVR systems to identify and segment callers. The ability to identify customers allows services to be tailored according to the customer profile. The caller can be given the option to wait in the queue, choose an automated service, or request a callback. The system may obtain caller line identification (CLI) data from the network to help identify or authenticate the caller. Additional caller authentication data could include account number, personal information, password and biometrics (such as voice print).
When an IVR system answers multiple phone numbers the use of DNIS ensures that the correct application and language is executed. A single large IVR system can handle calls for thousands of applications, each with its own phone numbers and script.
IVR also enables customer prioritization. In a system wherein individual customers may have a different status the service will automatically prioritize the individual's call and move customers to the front of a specific queue. Prioritization could also be based on the DNIS and call reason." [Interactive voice response. Wikipedia]
The IVR diagram example "Store reporting flowchart" was created using the ConceptDraw PRO diagramming and vector drawing software extended with the Interactive Voice Response Diagrams solution from the Computer and Networks area of ConceptDraw Solution Park.
IVR diagram

Design Element: IVR for Network Diagrams
")

Interactive Voice Response Network Diagram

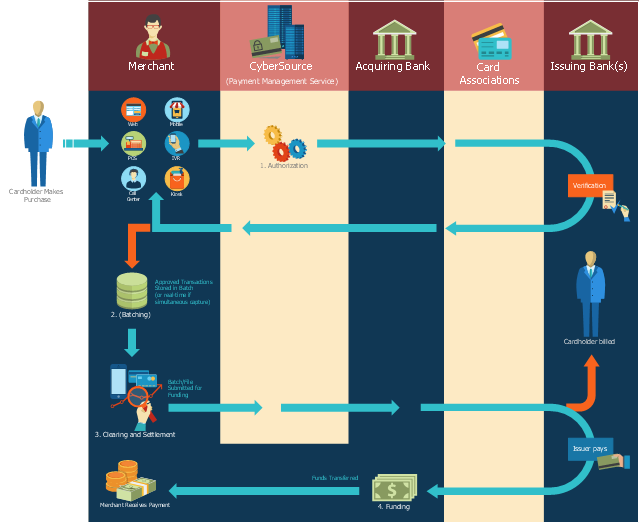
This payment process flowchart example was created on the base of the diagram of payment process using Global Payment Processing Services from the U.S. Securities and Exchange Commission website.
"Global Payment Processing Services. CyberSource Advanced enables merchants to accept payments made by all major credit and debit cards including American Express®, Discover®, Diners Club International®, JCB, MasterCard®, and Visa® cards. Our customers can also accept payment by corporate procurement cards, electronic checks, PayPal® Express Checkout, and the Bill Me Later® service. Merchants that have business models based on subscriptions can utilize the CyberSource recurring billing service with automated account updating services. For merchants selling internationally, we support direct debit, and bank transfers, as well as regional card brands such as Carte Bleue, Carta Si, Dankort, Laser, Solo, and Visa Electron. We provide these services for online, call center, kiosk, integrated voice response (“IVR”), and IP-enabled point of sale (“POS”) transactions."
[www.sec.gov/ Archives/ edgar/ data/ 934280/ 000119312510042764/ d10k.htm]
The flowchart example "Global Payment Solutions" was created using the ConceptDraw PRO diagramming and vector drawing software extended with the Sales Flowcharts solution from the Marketing area of ConceptDraw Solution Park.
Payment process flowchart
Control and Information Architecture Diagrams (CIAD) with ConceptDraw PRO

 Interactive Voice Response Diagrams
Interactive Voice Response Diagrams solution extends ConceptDraw PRO v10 software with samples, templates and libraries of ready-to-use vector stencils that help create Interactive Voice Response (IVR) diagrams illustrating in details a work of interactive voice response system, the IVR system’s logical and physical structure, Voice-over-Internet Protocol (VoIP) diagrams, and Action VoIP diagrams with representing voice actions on them, to visualize how the computers interact with callers through voice recognition and dual-tone multi-frequency signaling (DTMF) keypad inputs.
HelpDesk
How to Create an Interactive Voice Response (IVR) Diagram in ConceptDraw PRO
 diagram")
 Business Intelligence Dashboard
Business Intelligence Dashboard solution extends the ConceptDraw PRO v11 functionality with exclusive tools, numerous ready-to-use vector objects, samples and quick-start templates for creation professional Business Intelligence Dashboards, Business Intelligence Graphics, Business Intelligence Charts and Maps of different kinds. Design easy the BI dashboard, BI model or Dynamic chart in ConceptDraw PRO to monitor the company's work, to track the indicators corresponding your company's data, to display and analyze key performance indicators, to evaluate the trends and regularities of the processes occurring at the company.
HelpDesk
How to Create a Telecommunication Network Diagram in ConceptDraw PRO

- Call Center Process Flow Chart
- Flowchart Of Call Center Flow
- Call Center Process Flow Diagram
- Process Flowchart | Telecommunication Network Diagrams | Basic ...
- Flow Chart Diagram Of A Company From Call Center Industry Using
- Call Center Work Flow Chart
- Call center network diagram | Rack Diagrams | Metropolitan area ...
- Process Flowchart | Symboles Organigramme | Taxi Call Center ...
- Basic Flowchart Symbols and Meaning | Process Flowchart ...
- Inbound Call Center Process Flow Chart
- Call Center Flowchart
- Computer and Networks Area | Process Flowchart | Interactive Voice ...
- Process Flowchart | Basic Flowchart Symbols and Meaning ...
- Call Centre Process Flow Chart
- Telecommunication Network Diagrams | Process Flowchart ...
- Call Center Flowcharts
- Process Flow Chart For A Service Call
- Bpo Call Centre Process Through Diagram
- Process Flowchart | Summary Diagram Of A Phone Call Process
- Call Processes In A Call Center Visio