Flow process chart is used in quality control to display the action sequence of physical or manual process.
Flow process chart is useful for recording actions and documenting the production process.
Flow process chart helps to analyze and improve the process steps.
Flow process chart is more preferable than flowchart for documenting the mostly sequential processes.
Three types of flow process charts include: 1) man-type charts depicting the person actions, 2) material-type charts displaying the actions with product or material object, 3) equipment-type charts visualizing the useage of tools and equipment.
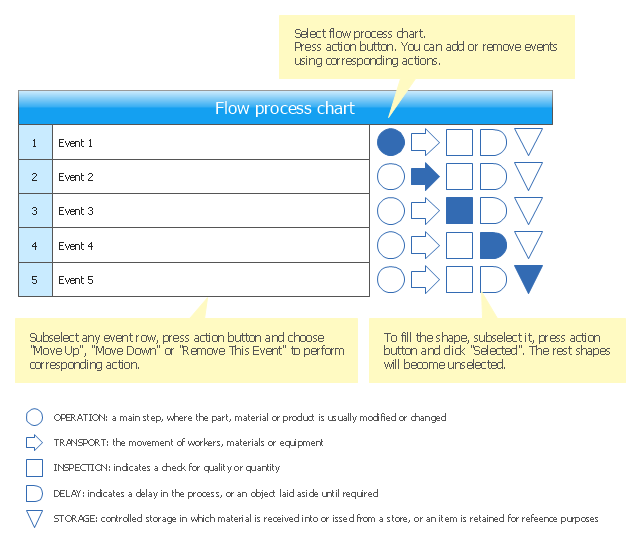
The set of symbols used in the flow process charts was developed by the American Society of Mechanical Engineers (ASME).
This flow process chart example was created using the ConceptDraw PRO diagramming and vector drawing software extended with the Matrices solution from the Marketing area of ConceptDraw Solution Park.
Flow process chart is useful for recording actions and documenting the production process.
Flow process chart helps to analyze and improve the process steps.
Flow process chart is more preferable than flowchart for documenting the mostly sequential processes.
Three types of flow process charts include: 1) man-type charts depicting the person actions, 2) material-type charts displaying the actions with product or material object, 3) equipment-type charts visualizing the useage of tools and equipment.
The set of symbols used in the flow process charts was developed by the American Society of Mechanical Engineers (ASME).
This flow process chart example was created using the ConceptDraw PRO diagramming and vector drawing software extended with the Matrices solution from the Marketing area of ConceptDraw Solution Park.
Flow process chart
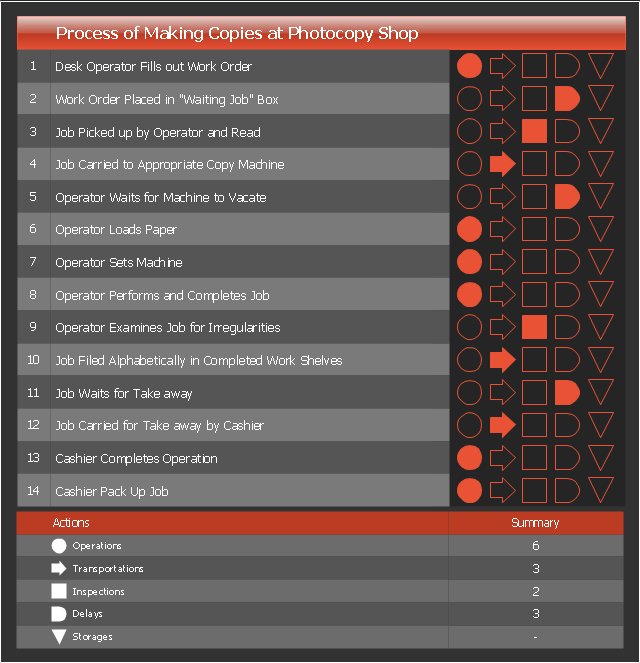
Process chart (flow process chart) visualize the simple process steps along a vertical line as action type symbols with action description. The action types include Operation, Transport, Inspection, Delay and Storage. Process chart are used to find ways of the processes improvement.
The template "Process chart" for the ConceptDraw PRO diagramming and vector drawing software is included in the Matrices solution from the Marketing area of ConceptDraw Solution Park.
The template "Process chart" for the ConceptDraw PRO diagramming and vector drawing software is included in the Matrices solution from the Marketing area of ConceptDraw Solution Park.
Flow process chart template
Material Requisition Flowchart. Flowchart Examples

Bar Diagrams for Problem Solving. Create space science bar charts with Bar Graphs Solution

 Universal Diagramming Area
This area collects solutions for drawing diagrams, charts, graphs, matrices, geographic and road maps for education, science, engineering, business.
- Flow process chart | Example Process Flow | Example of Flowchart ...
- Process Flowchart | Work Flow Diagrams with ConceptDraw PRO ...
- Flow process chart
- Flow process chart - Conceptdraw.com
- Process Flow app for Mac | Purchase Process Flow Chart | Business ...
- Cross Functional Flowchart Examples | Types of Flowchart ...
- Army Flow Charts | LLNL Flow Charts | Cross-Functional Flowcharts |
- Flow process chart | Value stream with ConceptDraw PRO ...
- Cross-Functional Process Map Template | Flow process chart | TQM ...
- Flow process chart | Process Flowchart | Hotel Network Topology ...
- Flow process chart | Matrices | Cross-Functional Flowchart |
- Data Flow Diagrams | How to Simplify Flow Charting Cross ...
- Flow process chart | - Conceptdraw.com
- Flow process chart | Universal Diagramming Area |
- Fishbone diagram - Production process | Total Quality Management ...
- Types of Flowchart - Overview | Process Flowchart | Cross ...
- Flow process chart | PM Agile |
- Flow process chart | Process flow diagram template | Cross ...
- Cross Functional Flowchart Examples | Types of Flowchart ...
- Flow Chart Diagram Examples | Cross-Functional Flowcharts ...