HelpDesk
How to Create a Cross - Functional Flowchart Using ConceptDraw PRO
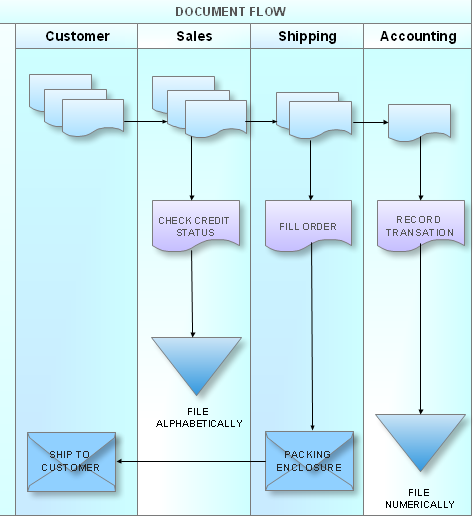
Cross-functional flowcharts are used to visualize cross-functional processes. Cross-functional process is a process that involves multiple divisions, each of which makes its part of the entire company workflow. For example: product development, lead management , client orders processing – and other critical processes. All of them are important both for business and customers, but the workflow and responsibilities distribution within these processes are divided between multiple departments and services. Cross-functional processes cannot be depicted with simple workflow diagrams, because of the specific interactions between company departments. ConceptDraw PRO has released the specialized solution to create cross-functional diagrams. Cross Functional Flowcharts solution includes a special set of templates and libraries to depict the cross-functional processes.
HelpDesk
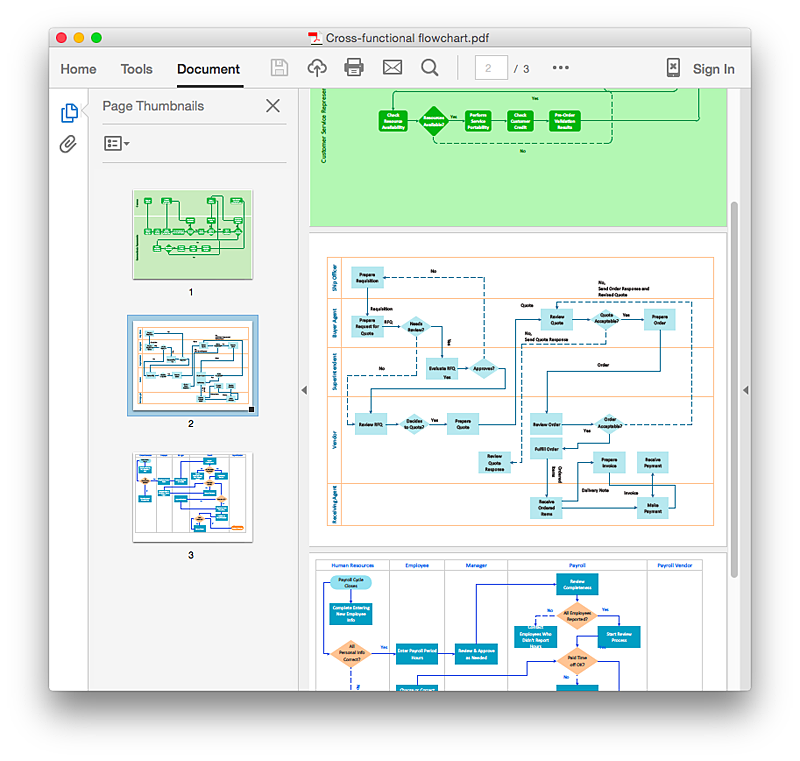
How to Add a Cross-Functional Flowchart to an Adobe PDF Using ConceptDraw PRO
ConceptDraw PRO allows you to easy share your business process documentation between different computers with different operating systems and applications using it's export capabilities. You can get your cross-functional flowcharts in pdf format and avoid any problems while communicating them.HelpDesk
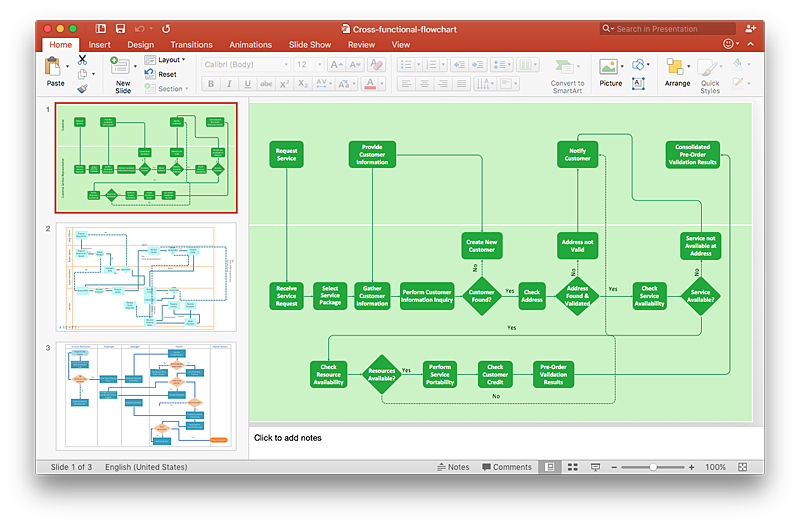
How to Add a Cross-Functional Flowchart to a PowerPoint Presentation Using ConceptDraw PRO
Using a Cross-Functional flowchart is a clear way of showing how business processes get shared or transferred between different teams and departments. ConceptDraw PRO allows you to make an MS PowerPoint Presentation from your flowcharts in a few simple steps.How to Create a Cross Functional Flow Chart
If neither of 45 vector shapes of the Cross-Functional Flowcharts solution don't fit your needs, you will want to learn How to create a unique Cross-Functional flowchart. ConceptDraw Arrows10 Technology - This is more than enough versatility to draw any type of diagram with any degree of complexity. Drawing software lets you to make horizontal and vertical, audit, opportunity and many more flowcharts.HelpDesk
Event-driven Process Chain (EPC) Diagram Software
An EPC diagram is a type of flowchart used in business process analysis. It shows different business processes through various work flows. The workflows are shown as processes and events that are related to different executes and tasks that allow business workflow to be completed. An EPC diagram shows different business processes through various workflows. The workflows are seen as functions and events that are connected by different teams or people, as well as tasks that allow business processes to be executed. The best thing about this type of enterprise modelling is that creating an EPC diagram is quick and simple as long as you have the proper tool. One of the main usages of the EPC diagrams is in the modelling, analyzing and re-engineering of business processes. With the use of the flowchart, businesses are able to see inefficiencies in the processes and modify to make them more productive. Event-driven process chain diagrams are also used to configure an enterprise resource pla- Organizational Structure | Functional Organizational Structure ...
- Block Diagram Of Function Organization Management
- Function Organization Structure Block Diagram
- Functional Organizational Structure | Process Flowchart | Event ...
- Draw A Chart For A Functional Organization
- Functional Organizational Chart
- Organizational Charts with ConceptDraw PRO | Process Flowchart ...
- Flow chart Example. Warehouse Flowchart | Functional ...
- Example Of Functional Organizational Chart In Business
- Functional Organizational Structure | Organizational Structure ...
- 25 Typical Orgcharts | Organizational Charts with ConceptDraw ...
- How to Draw an Organization Chart | Functional Organizational ...
- Organogram Software | Create Organizational Chart | Functional ...
- Organizational Structure | Functional Organizational Structure ...
- Security and Access Plans | ConceptDraw PRO - Organizational ...
- Organizational Chart Template | Functional Organizational Structure ...
- Organizational Structure | Process Flowchart | Cross- Functional ...
- Organizational Structure | Functional Organizational Structure | How ...
- Organizational Structure | Functional Organizational Structure ...


