HelpDesk
How to Add a Circle-spoke Diagram to a PowerPoint Presentation Using ConceptDraw PRO
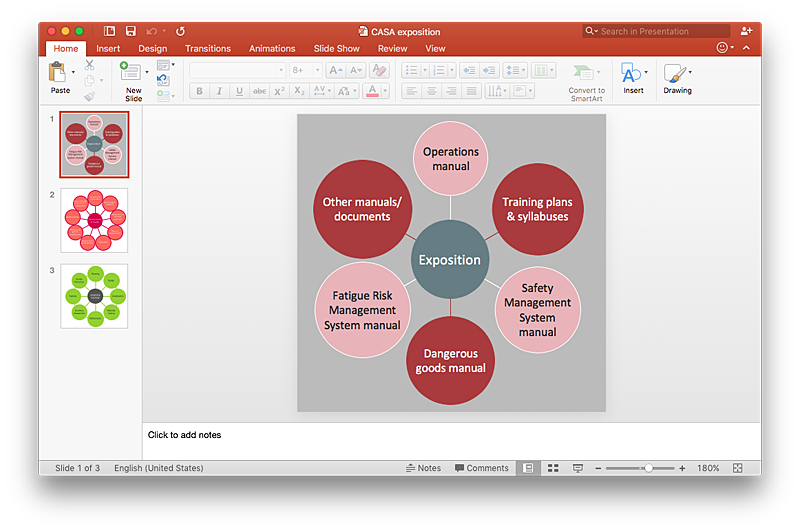
ConceptDraw PRO can be used as a tool for creating circle spoke diagrams along with other marketing diagrams. ConceptDraw PRO allows you to make a MS PowerPoint Presentation from your marketing diagrams in a few simple steps.HelpDesk
How to Draw a Circle-Spoke Diagram Using ConceptDraw PRO
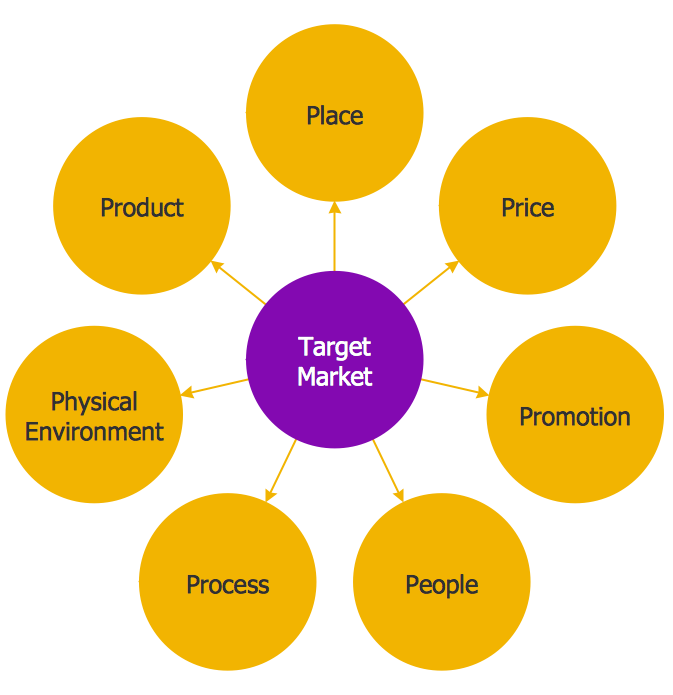
Making circle-spoke diagram is a very useful technique if you want to explore cause and effect. A Circle-Spoke Diagram is a tool that is often used in marketing sphere. Circle-spoke diagram consists from a central circle surrounded in a round arrangement by related sub-circles. They are used to depict the features or components of a central item in a number of areas. Circle-spoke diagram are widely used in marketing and management documents as well as presentations. A Circle-Spoke Diagram is a very useful tool if you want to perform the Cause and Effect analysis. ConceptDraw PRO delivers the ability to make circle-spoke diagrams of various styles with its Circle-Spoke Diagrams solution.
 Basic Circle-Spoke Diagrams
Basic circle-spoke diagrams are well suited for marketing, management documents, and presentations.
 Circle-Spoke Diagrams
Examples of subject areas that are well suited to this approach are marketing, business, products promotion, process modeling, market, resource, time, and cost analysis. Circle-Spoke Diagrams are successfully used in presentations, conferences, management documents, magazines, reportages, reviews, reports, TV, and social media.
HelpDesk
How to Add a Circle-Spoke Diagram to a MS Word Document Using ConceptDraw PRO
ConceptDraw PRO allows you to easily create various marketing charts, including the circle-spoke diagrams and then insert them into a MS Word document.HelpDesk
How to Create a Timeline Diagram in ConceptDraw PRO
A Timeline is a chart which displays a project plan schedule in chronological order. A Timeline is used in project management to depict project milestones and visualize project phases, and show project progress. The graphic form of a timeline makes it easy to understand critical project milestones, such as the progress of a project schedule. Timelines are particularly useful for project scheduling or project management when accompanied with a Gantt chart. It captures the main of what the project will accomplish and how it will be done. making a project timeline is one of the most important skills a project manager needs have. Making comprehensive, accurate timelines allows you getting every project off in the best way. ConceptDraw PRO allows you to draw a timeline charts using special library.The vector stencils library "Android system icons - file" contains 13 cloud and file pictograms.
Use this icon set to design user interface of your Android application.
The icons example "Design elements - Android system icons (file)" was created using the ConceptDraw PRO diagramming and vector drawing software extended with the "Android user interface" solution from the "Software Development" area of ConceptDraw Solution Park.
HelpDesk
How to Connect a Live Object to a Text Data Source
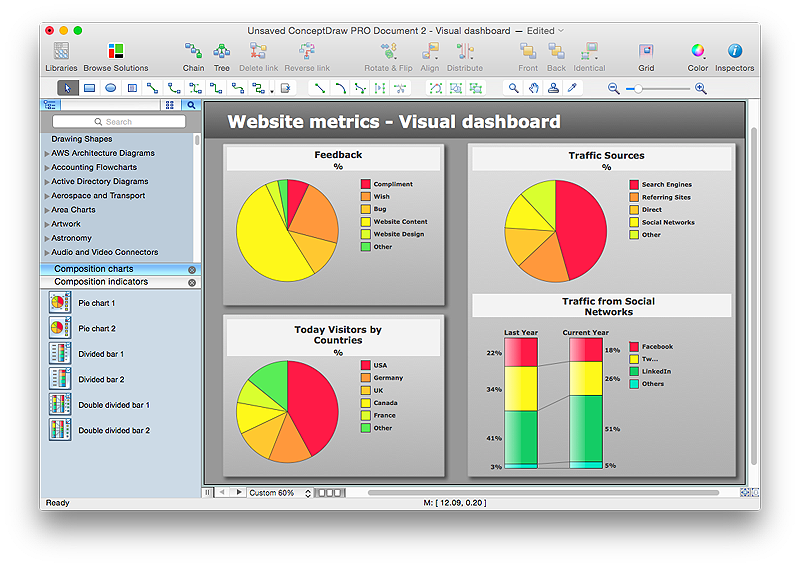
Instruction on how to connect a ConceptDraw live object with data source files in TXT format to visualize the actual values of your performance metrics.
- System Icon Android Circle
- Search Icon Png In Circle
- Basic Flowchart Symbols and Meaning | Circular Shaped Icon For ...
- Research cycle - Circle diagram | Flowchart design. Flowchart ...
- Yellow Icon Circle Server
- Database Icon Circle White Blue
- Arrow Yellow Circle
- Vicious circle - Crystal diagram | Business - Vector stencils library ...
- Research cycle - Circle diagram | Export from ConceptDraw PRO ...
- Email Vector Icon Circle
- Basic Flowchart Symbols and Meaning | Circle Spoke Diagram ...
- Process Flow Chart Symbols | Value Stream Mapping Symbols ...
- Cloud round icons - Vector stencils library
- Circle Diagrams | How To Convert a Circle -Spoke Diagram to an ...
- Ladder of customer loyalty diagram | Loyalty - Arrow circle diagram ...
- How to Save a Drawing as a Graphic File in ConceptDraw PRO ...
- Circle Diagrams | Research cycle - Circle diagram | Lifecycle of an ...
- ConceptDraw Office for Windows Installation Definition | User ...
- Design elements - Android system icons ( file ) | Design elements ...
- Circle Photo Png


