 Marketing
This solution extends ConceptDraw DIAGRAM and ConceptDraw MINDMAP with Marketing Diagrams and Mind Maps (brainstorming, preparing and holding meetings and presentations, sales calls).
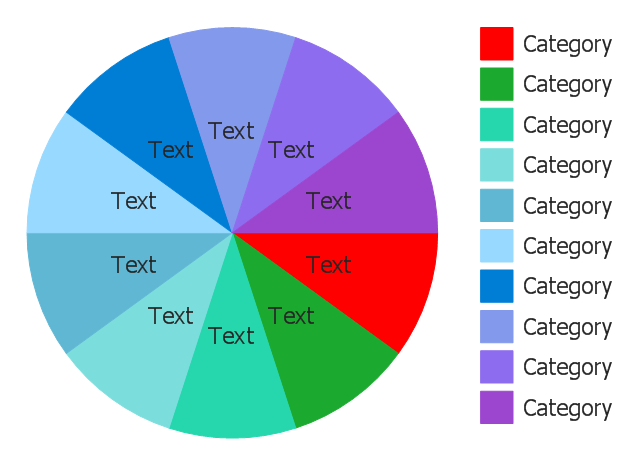
Use this circle chart template to design your sector diagrams.
"A chart is a graphical representation of data, in which the data is represented by symbols, such as ... slices in a pie chart. ... Charts are often used to ease understanding ... the relationships between parts of the data. ... For example, data that presents percentages in different groups (such as "satisfied, not satisfied, unsure") are often displayed in a pie chart ... A pie chart shows percentage values as a slice of a pie." [Chart. Wikipedia]
The template "Sector diagram" for the ConceptDraw PRO diagramming and vector drawing software is included in the Pie Charts solution of the Graphs and Charts area in ConceptDraw Solution Park.
 Matrices
This solution extends ConceptDraw DIAGRAM software with samples, templates and library of design elements for drawing the business matrix diagrams.
 Fishbone Diagram
Fishbone Diagrams solution extends ConceptDraw DIAGRAM software with templates, samples and library of vector stencils for drawing the Ishikawa diagrams for cause and effect analysis.
Business diagrams & Org Charts with ConceptDraw DIAGRAM
The business diagrams are in great demand, they describe the business processes, business tasks and activities which are executed to achieve specific organizational and business goals, increase productivity, reduce costs and errors. They let research and better understand the business processes. ConceptDraw DIAGRAM is a powerful professional cross-platform business graphics and business flowcharting tool which contains hundreds of built-in collections of task-specific vector stencils and templates. They will help you to visualize and structure information, create various Business flowcharts, maps and diagrams with minimal efforts, and add them to your documents and presentations to make them successful. Among them are Data flow diagrams, Organization charts, Business process workflow diagrams, Audit flowcharts, Cause and Effect diagrams, IDEF business process diagrams, Cross-functional flowcharts, PERT charts, Timeline diagrams, Calendars, Marketing diagrams, Pyramids, Target diagrams, Venn diagrams, Comparison charts, Analysis charts, Dashboards, and many more. Being a cross-platform application, ConceptDraw DIAGRAM is very secure, handy, free of bloatware and one of the best alternatives to Visio for Mac users.
- Matrices | Feature comparison chart - Digital scouting cameras ...
- Feature comparison chart - Digital scouting cameras | Matrices ...
- Matrices | Seven Management and Planning Tools | Feature ...
- Feature comparison chart - Digital scouting cameras | Marketing ...
- Weekly to-do chore chart checklist template | Deployment chart ...
- What is a Dashboard Area | Composition Dashboard | Basic ...
- Chore charts with ConceptDraw PRO | Weekly to-do chore chart ...
- Matrices | Seven Management and Planning Tools | SWOT analysis ...
- Marketing | Fishbone Diagram | SWOT analysis Software ...
- Marketing | PM Agile | Comparison Dashboard |
- SWOT analysis Software & Template for Macintosh and Windows ...
- SWOT analysis Software & Template for Macintosh and Windows ...
- SWOT Analysis Solution - Strategy Tools | TOWS analysis matrix ...
- What is Infographics Area |
- Deployment chart template | SWOT Analysis Solution - Strategy ...
- SWOT analysis Software & Template for Macintosh and Windows ...
- TOWS analysis matrix diagram - Template
- Competitive strategy matrix | Competitive strategy matrix template
- Composition Dashboard | What is a Dashboard Area | Comparison ...
- Sales Dashboard Template | Europe spatial dashboard template ...

