This site uses cookies. By continuing to browse the ConceptDraw site you are agreeing to our Use of Site Cookies.
HelpDesk

How to Use ConceptDraw Sales Dashboard Solution

An interactive visual dashboard is a valuable tool for any sales team. Sales dashboard allows you to view and monitor sales indicators that are important for manager and sales staff. It helps to use timely and reliable information to improve the quality of sales performance and increase sales revenues. ConceptDraw Sales Dashboard solution is a tool for both: sales manager and sales team. It provides the visualization of key performance indicators that are critical to the entire sales organization. The custom sales dashboard displays real-time information on sales performance KPIs with the help of intuitive and easy-to-understand diagrams and charts. Sales Dashboard helps the entire team see where they are, and what needs to be done. With ConceptDraw DIAGRAM you can easily create a visual Sales Dashboard using Live Objects Technology.
HelpDesk

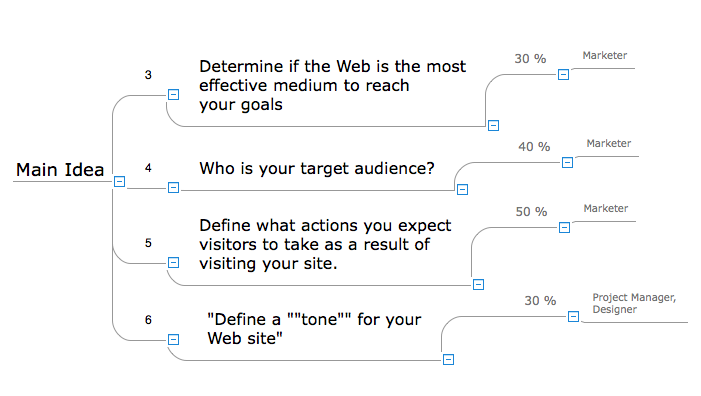
How to Input Data from MS Excel Into a Mind Map

Many people apply Excel documents to store data in the form of hierarchical lists. With ConceptDraw MINDMAP you can easily turn the linear structure of an Excel table in a radial structure of mind map ConceptDraw MINDMAP will create a mind map file (CDMZ) from your Excel (XLS) file. If you keep your information in the Microsoft Excel files, you can import them into ConceptDraw MINDMAP, converting the columns and rows to a hierarchically structured mind map. If you have multiple individual sheets in your Excel workbook, ConceptDraw MINDMAP will turn them into a single multi-page mind map. ConceptDraw MINDMAP lets you import an entire Microsoft® Excel file as well as insert data from the selected cells.
HelpDesk

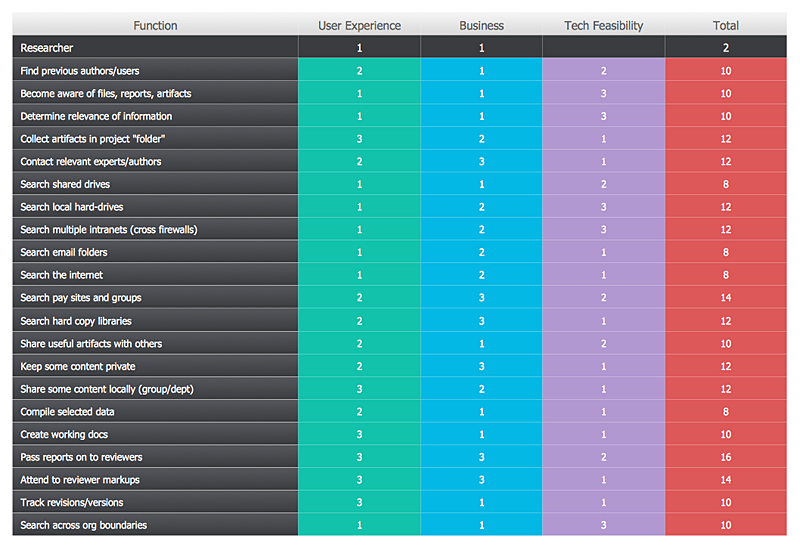
How To Create a Prioritization Matrix

Making the prioritization matrix is helpful when all cannot be done at the same time. Prioritization matrix diagram shows the relationships between factors and this helps, to prioritize tasks and resources. This helps you to narrow down variants. By selecting and weighing options you can quickly determine the best choices and direct team to the best destinations. Prioritization matrix helps to identify the best way of implementing the most priority tasks. It is helpful in a case when you have limited resources. ConceptDraw solution for management and planning compiled from the Seven Management and Planning Tools provides the ability to quickly build Prioritization Matrix diagrams for your project using a special template.
HelpDesk

How to Create an Azure Architecture Diagram

Microsoft Azure is an open cloud computing platform, designed by Microsoft. It provides the ability to develop and launch applications and to store data on servers in distributed data centers. Microsoft Azure cloud offers two models - platform as a service (PaaS) and infrastructure as a service (IaaS). The efficiency of the Windows Azure platform is supported by a global network of Microsoft data centers. Developers use Azure Architecture diagrams to visualize and document the architecture of applications based on Microsoft Azure services. Using the ConceptDraw Azure Architecture solution makes much easier the work on documenting the Microsoft Azure architecture.
HelpDesk

How to Generate Tabular Reports in ConceptDraw PROJECT for macOS

Project reporting is one of the key functions of effective project management. Using regular project reports, a project manager can constantly track and analyze the project’s execution. This analytic process can help to ensure that the team reaches the best possible solutions. ConceptDraw PROJECT is a professional software tool for project management with the advanced mechanism of reporting. You can create the set of regular reports on project activities, task statuses, cash flow and assignments in MS Excel format. Mind map reports are also available.
HelpDesk

How to Draw a Fishbone Diagram

Fishbone (Ishikawa) Diagram is often used in business to determine the cause of some problem. A Fishbone diagram is also called a cause-and-effect diagram. The main goal of the Fishbone diagram is to illustrate in a graphical way the relationship between a given outcome and all the factors that influence this outcome. The complete diagram resembles a fish skeleton as its name implies. Cause and Effect analysis is used in management to identify the possible causes of a problem in order to eliminate them. The ability to create a Fishbone Diagram is supported by the Fishbone Diagram solution.
HelpDesk

How to Draw a Matrix Organizational Chart

There are a number of moments which are influenced by how the organizational structure of a certain business needs to be, how complex, and which type it should keep. The matrix organizational structure is atypical because it brings together employees and managers from different departments to work toward accomplishing a goal. This structure is commonly found in businesses that have more than one line of reportage. For instance, a company might contain an engineering department with engineering managers who workers report to. However, these workers might also have to liaise with a different product or project managers depending on current tasks. Some form of matrix organization is found in most large-scale modern businesses. It is one of the most complicated reporting structures. You can easily build a clear matrix organizational chart in ConceptDraw DIAGRAM using templates from ConceptDraw Solution Park.

Pie Chart Examples and Templates

A pie chart or a circle graph is a circular chart divided into sectors, illustrating numerical proportion. In a pie chart, the arc length of each sector and consequently its central angle and area, is proportional to the quantity it represents.

Pie chart examples and templates created using ConceptDraw DIAGRAM software helps you get closer with pie charts and find pie chart examples suite your needs.

Circle Spoke Diagram Template

ConceptDraw DIAGRAM diagramming and vector drawing software offers the Circle Spoke Diagram Template included in the Circle-Spoke Diagrams Solution from the "Diagrams" Area. Use of ready template is the easiest way of drawing professional looking Circle-Spoke Diagrams.

dashboard software, social community dashboard, dashboard facebook ConceptDraw Dashboard for Facebook

dashboard software, social community dashboard, dashboard facebook
ConceptDraw Dashboard for Facebook solution extends ConceptDraw DIAGRAM software with a dynamically updated visual dashboard, which shows lifetime total likes, daily friends of fans, and daily page views, information you can receive from Facebook Insights.