 Entity-Relationship Diagram (ERD)
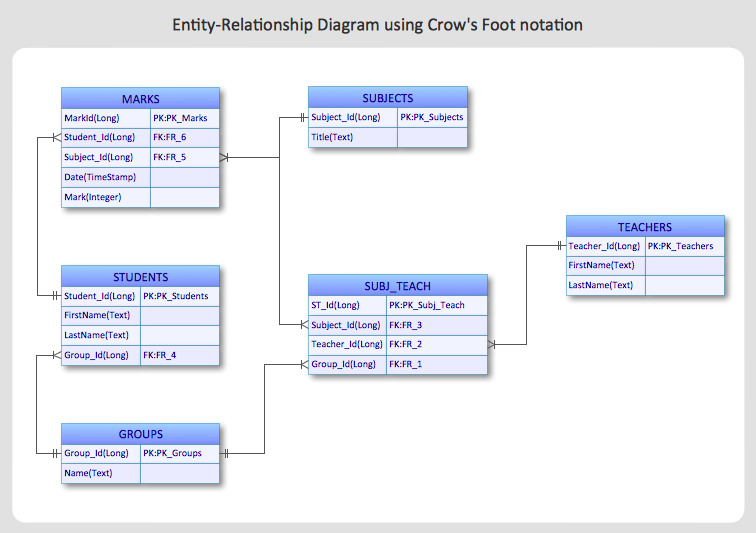
Entity-Relationship Diagram (ERD) solution extends ConceptDraw PRO software with templates, samples and libraries of vector stencils from drawing the ER-diagrams by Chen's and crow’s foot notations.
 Entity-Relationship Diagram (ERD)
An Entity-Relationship Diagram (ERD) is a visual presentation of entities and relationships. That type of diagrams is often used in the semi-structured or unstructured data in databases and information systems. At first glance ERD is similar to a flowch
Create Block Diagram
Block diagrams solution extends ConceptDraw PRO software with templates, samples and libraries of vector stencils for creating the block diagram. Create block diagrams, electrical circuit diagrams, schematics, and more in minutes with ConceptDraw PRO.ConceptDraw Arrows10 Technology
How should diagramming software work? Is it possible to develop a diagram as quickly as the ideas come to you? The innovative ConceptDraw Smart Connectors Technology - This is more than enough versatility to draw any type of diagram with any degree of complexity. Connection points are necessary for diagramming network, flowchart and organizational charts. In ConceptDraw you connect shapes by attaching, or snapping and gluing, connectors to shape connection points.ConceptDraw Arrows10 Technology
Connecting objects manually in ConceptDraw PRO is a snap: - points; - Connecting groups of objects; - Auto-routing; - Connectors text; - Snap to Guides ; - Quick.Diagramme Zeichnen
No need for any special drawing skills to create professional looking diagrams outside of your knowledge base. ConceptDraw PRO takes care of the technical details, allowing you to focus on your job, not the drawing.HelpDesk
How to Create an ERD Diagram
ERD (entity relationship diagram) is used to show the logical structure of databases. It represents the interrelationships between components of database (entities). Entity relationship diagrams are a widely used in software engineering. Using ERD software engineers can control the every aspect of database development. ER diagram can be used as guide for testing and communicating before the release of software product. ERD displays data as entities that are connected with connections that show the relationships between entities. There is some ERD notations used by data bases developers for representing the relationships between the data objects. ConceptDraw PRO and its ERD solution allow you to build ERD diagram of any notation.HelpDesk
How to Create an Entity-Relationship Diagram Using ConceptDraw Solution Park
An entity-relationship diagram (ERD)is used in a database modeling process. ERD diagram shows a graphical representation of objects or concepts within an information system and their relationships.The ability to describe a database using the Entity-Relationship model is delivered by the ConceptDraw ERD solution.
 Interactive Voice Response Diagrams
Interactive Voice Response Diagrams solution extends ConceptDraw PRO v10 software with samples, templates and libraries of ready-to-use vector stencils that help create Interactive Voice Response (IVR) diagrams illustrating in details a work of interactive voice response system, the IVR system’s logical and physical structure, Voice-over-Internet Protocol (VoIP) diagrams, and Action VoIP diagrams with representing voice actions on them, to visualize how the computers interact with callers through voice recognition and dual-tone multi-frequency signaling (DTMF) keypad inputs.
 Fault Tree Analysis Diagrams
This solution extends ConceptDraw PRO v9.5 or later with templates, fault tree analysis example, samples and a library of vector design elements for drawing FTA diagrams (or negative analytical trees), cause and effect diagrams and fault tree diagrams.
- Crow's foot ERD - Educational data base | Entity-Relationship ...
- How to Purchase ConceptDraw Products for Academic/Nonprofit ...
- Entity-Relationship Diagram ( ERD ) | Education | Physics Symbols ...
- Education System Er Diagram
- Physics Diagrams | Mathematical Diagrams | Crow's foot ERD ...
- Entity-Relationship Diagram ( ERD ) | Software Diagrams | Education ...
- Er Diagram Education Site
- Entity-Relationship Diagram ( ERD ) | Fishbone Diagram | Education ...
- Entity-Relationship Diagram ( ERD ) | Education | Illustration ...
- Education | Entity-Relationship Diagram ( ERD ) | Illustration ...
- ERD Symbols and Meanings | Entity-Relationship Diagram ( ERD ...
- Education System Sequence Diagram
- Education | Entity-Relationship Diagram ( ERD ) | Illustration | Swot ...
- Compound sentence | Education | Entity-Relationship Diagram ...
- Education | Entity-Relationship Diagram ( ERD ) | ConceptDraw ...
- Education | ConceptDraw Solution Park | Entity-Relationship ...
- Education | Software Diagrams | Entity-Relationship Diagram ( ERD ...
- Education | Entity-Relationship Diagram ( ERD ) | School and ...
- Education Database For Er Diagram
- Educational Diagram


