This site uses cookies. By continuing to browse the ConceptDraw site you are agreeing to our Use of Site Cookies.

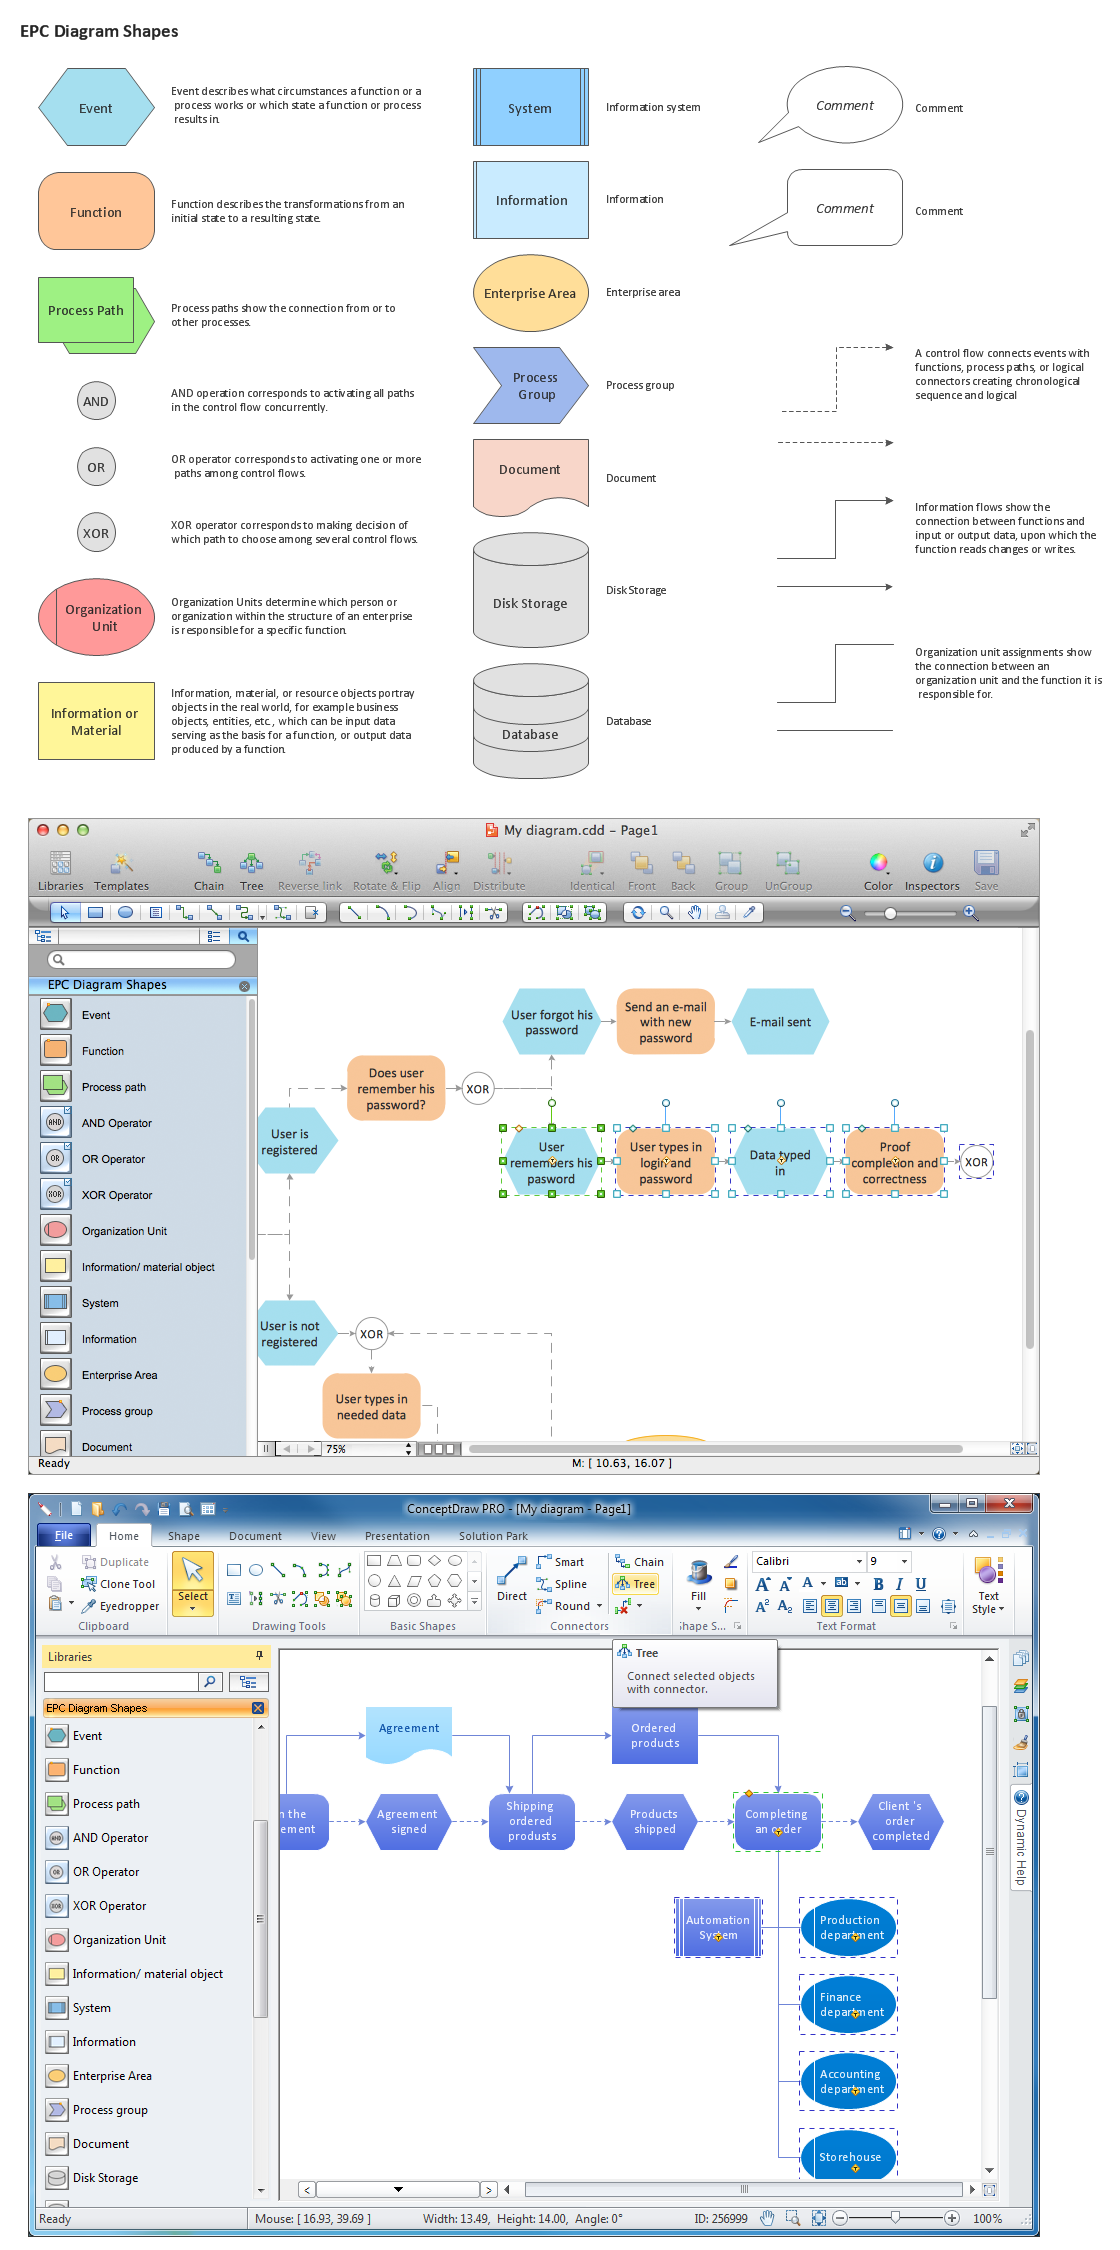
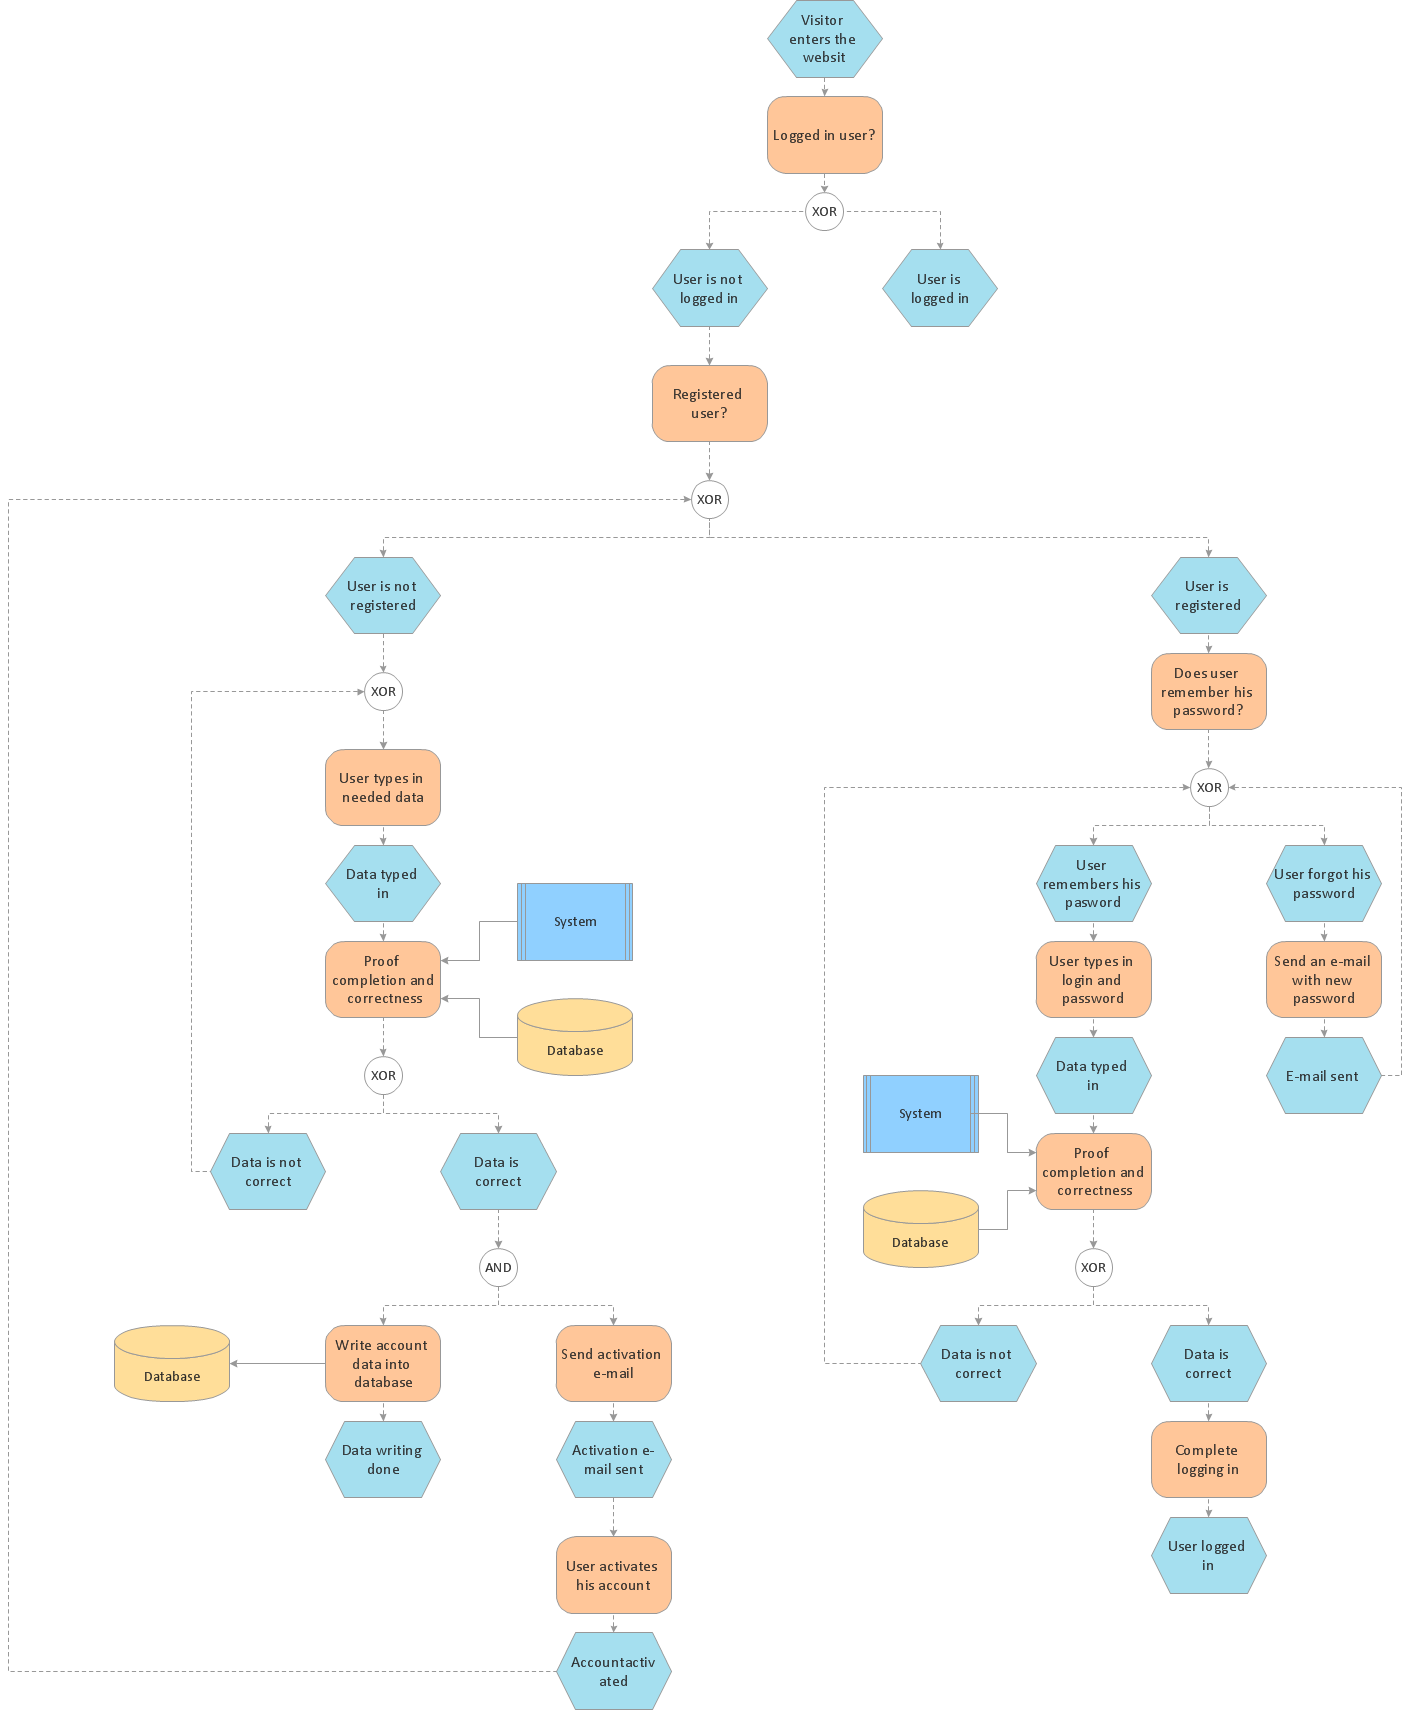
Business process Flow Chart — Event-Driven Process chain (EPC) diagrams

Event-Driven Process chain Diagrams for improvement throughout an organisation. Best software for Process Flow Diagram. The Event-driven Process Chain (EPC) Diagrams allows managers to plan processes and resources.

Structuring a business process as a chain of events and functions

Event-Driven Process Chain Diagrams for improvement throughout an organisation.
ConceptDraw DIAGRAM - software that reduces the time needed to create a business process model.

Examples of Flowcharts, Org Charts and More

ConceptDraw examples covers a broad spectrum of business graphics categories. We separated all the graphic documents on application areas and had produced multiple solutions for each of them. ConceptDraw provides a wide variety of examples such as flowcharts, organizational charts, business charts, UML diagrams, database and ERD, directional map, network diagrams and lots more. Each solution accommodates 10+ examples that shows specific application cases of a diagram. ConceptDraw STORE is an application for downloading solutions with examples, templates and stencil libraries. Please choose any examples you are interested in, alternatively download them for free; you will need to install ConceptDraw to view them. As you will see, ConceptDraw is very powerful, you can use more than 10000 symbols, examples, and many pre-drawn templates, to create your own spectacular flowcharts, business diagrams, network diagrams and lots more, effortlessly, and in no time at all.
What is ConceptDraw OFFICE

Modelling Complex Events with Event-Driven Process chain

Event-Driven Process Chain Diagrams for improvement throughout an organisation.
ConceptDraw DIAGRAM - software that reduces the time needed to create a business process model.

organizational chart examples, business organizational chart, organogram, organigram, organizational structure , corporate hierarchy, organizational structure chart, organizational management , org chart maker, how to make an organizational chart, busines 25 Typical Orgcharts

organizational chart examples, business organizational chart, organogram, organigram, organizational structure , corporate hierarchy, organizational structure chart, organizational management , org chart maker, how to make an organizational chart, busines
The 25 Typical Orgcharts solution contains powerful organizational structure and organizational management drawing tools, a variety of professionally designed organization chart and matrix organization structure samples, 25 templates based on various orga

Identifying Quality Management System

The Total Quality Management Diagram solution helps your organization visualize business and industrial processes. Create Total Quality Management diagrams for business process with ConceptDraw software.

The Best Tool for Business Process Modeling

The EPC diagram shows various business processes in terms of work flows.
Event-Driven Process chain Diagrams for improvement throughout an organisation.
ConceptDraw DIAGRAM - software that reduces the time needed to create a business process model and is great business process improvement tools.

How to Help Customers be More Productive

Presenting you with a drawing program which could really surprise you with their great functionality.

Don't know how to start to draw Connector's improvement?
Curious how should diagramming software work?

Drawing programs involve a lot of things like designs in an illustrative way, creating an cherts, Tools to create high end graphics, create dashboards, using your data and many other technical aspects do it in a much professional and in a quick way.

Business Process Modeling Notation

ConceptDraw DIAGRAM is a software for simplу depicting the business processes based on BPMN 2.0.
Business Process Diagrams Cross-Functional-Flowcharts, Workflows, Process Charts, IDEF0 and IDEF2, Timeline, Calendars, Gantt Charts, Business Process Modeling, Audit and Opportunity Flowcharts and Mind Maps (presentations, meeting agendas).

Horizontal Orgchart

The Organizational Chart is a diagram that shows the structure of the organization and the relationships of its parts. There are many ways to present the Organizational Chart. One of them is the Horizontal Organizational Chart: the parts of the diagram are arranged from left to right, or from right to left.
This sample was created in ConceptDraw DIAGRAM diagramming and vector drawing software using the Organizational Charts Solution from the Management area of ConceptDraw Solution Park.