The vector stencils library "Ecology pictograms" contains 20 ecological pictograms.
Use it to draw your eco illustrations, presentations, web pages and infographics.
The example "Design elements - Ecology pictograms" was created using the ConceptDraw PRO diagramming and vector drawing software extended with the Pictorial Infographic solution from the area "What is infographics" in ConceptDraw Solution Park.
Eco pictograms
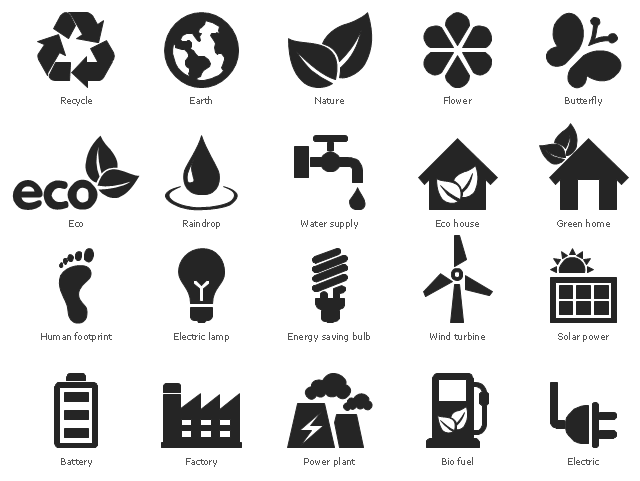
The vector stencils library "Ecology pictograms" contains 20 icons of eco symbols. Use it to draw your ecological infographics. The example "Ecology pictograms - Vector stencils library" was created using the ConceptDraw PRO diagramming and vector drawing software extended with the Pictorial infographics solution from the area "What is infographics" in ConceptDraw Solution Park.
Recycle
Nature

Flower

Butterfly

Earth

Raindrop

Water supply
Eco house

Green home
Electric

Electric lamp
Energy saving bulb

Factory
Power plant
Battery
Bio fuel
Wind turbine
Solar power

Eco
Human footprint

The vector stencils library "Transport pictograms" contains 23 vehicle pictograms.
Use it to draw transportation infograms.
The example "Transport pictograms - Vector stencils library" was created using the ConceptDraw PRO diagramming and vector drawing software extended with the Pictorial infographics solution from the area "What is infographics" in ConceptDraw Solution Park.
Use it to draw transportation infograms.
The example "Transport pictograms - Vector stencils library" was created using the ConceptDraw PRO diagramming and vector drawing software extended with the Pictorial infographics solution from the area "What is infographics" in ConceptDraw Solution Park.
Tractor
Forklift truck

Truck

Plane

Aircraft

Helicopter
Balloon
Rocket

Liner
Sailboat

Locomotive
Train
Subway

Car
Taxi
Electric car
Tram
Bus

Aerial tramway

Trailer

Tow truck
Motorcycle
Bicycle
The vector stencils library "Transport pictograms" contains 23 vehicle pictograms.
Use it to draw transportation infograms.
The example "Transport pictograms - Vector stencils library" was created using the ConceptDraw PRO diagramming and vector drawing software extended with the Pictorial infographics solution from the area "What is infographics" in ConceptDraw Solution Park.
Use it to draw transportation infograms.
The example "Transport pictograms - Vector stencils library" was created using the ConceptDraw PRO diagramming and vector drawing software extended with the Pictorial infographics solution from the area "What is infographics" in ConceptDraw Solution Park.
Tractor
Forklift truck
Truck
Plane
Aircraft
Helicopter
Balloon
Rocket
Liner
Sailboat
Locomotive
Train
Subway
Car
Taxi
Electric car
Tram
Bus
Aerial tramway
Trailer
Tow truck
Motorcycle
Bicycle
The vector stencils library "Time and clock pictograms" contains 20 time pictograms: clocks, calendars, day, week, bell, alarm clock, hourglass, wristwatch, and time intervals symbols.
Use it to create temporal infographic, illustrations and diagrams.
The example "Time and clock pictograms - Vector stencils library" was created using the ConceptDraw PRO diagramming and vector drawing software extended with the Pictorial infographics solution from the area "What is infographics" in ConceptDraw Solution Park.
Time
Stopwatch

Stopwatch 15"
Stopwatch 30"
Stopwatch 45"
24 h
7 d
Circle clock

Clock time
Time o'clock
Time - quarter past
Time - half past
Time - quarter to

Full time

Calendar

Current date

Hourglass

Wristwatch

Alarm clock

Bell

Design Pictorial Infographics. Design Infographics

Infographic Maker

Electrical Symbols, Electrical Diagram Symbols

 Food Court
Use the Food Court solution to create food art. Pictures of food can be designed using libraries of food images, fruit art and pictures of vegetables.
- Eco pictograms
- Pictogram Eco
- Eco Png
- Ecology pictograms - Vector stencils library | Ecology pictograms ...
- Ecology pictograms - Vector stencils library | Eco Picto
- Ecology pictograms - Vector stencils library | Design elements ...
- Design elements - Ecology pictograms | Ecology pictograms - Vector ...
- Design elements - Ecology pictograms
- Eco Home Pictograms
- Renewable energy | Design elements - Ecology pictograms | Design ...
- Renewable energy | Design elements - Ecology pictograms ...
- Ecology pictograms - Vector stencils library | How to Draw Pictorial ...
- Design elements - Pumps | Ecology pictograms - Vector stencils ...
- Plumbing and Piping Plans | Ecology pictograms - Vector stencils ...
- Ecology pictograms - Vector stencils library | Types of Flowcharts ...
- HR Flowchart Symbols | Ecology pictograms - Vector stencils library ...
- Sport pictograms . Olympic Games | Transport pictograms - Vector ...
- Ecology pictograms - Vector stencils library
- Ecology pictograms - Vector stencils library | Electricity Picto
- Pictograms Design