Basic Network Diagram
The Basic Network Diagram is an easy and effective way to design and document a simple network, it lets to represent visually and logically how the different network devices and computer equipment can be installed to meet the main business needs. ConceptDraw DIAGRAM software supplied with Computer Network Diagrams solution from the Computer and Networks area of ConceptDraw Solution Park is a perfect tool for drawing the Basic Computer Network diagrams, designs, schematics, and maps, network architectures, topologies, and layouts. Numerous vector libraries of network symbols, icons and components are incredibly helpful for IT and telecom engineers, stakeholders and end-users when designing Basic Network Diagrams, Common Network Diagrams, Common Network Topologies, 10Base-T Star Network Topologies, Bus Topology Diagrams, Communication Network Diagrams, System Designs, Regional Cable Head-End Diagrams, etc. Collection of predesigned samples and templates included to Computer Network Diagrams solution also greatly extends the capabilities of ConceptDraw DIAGRAM users.
HelpDesk
How to Create a Telecommunication Network Diagram
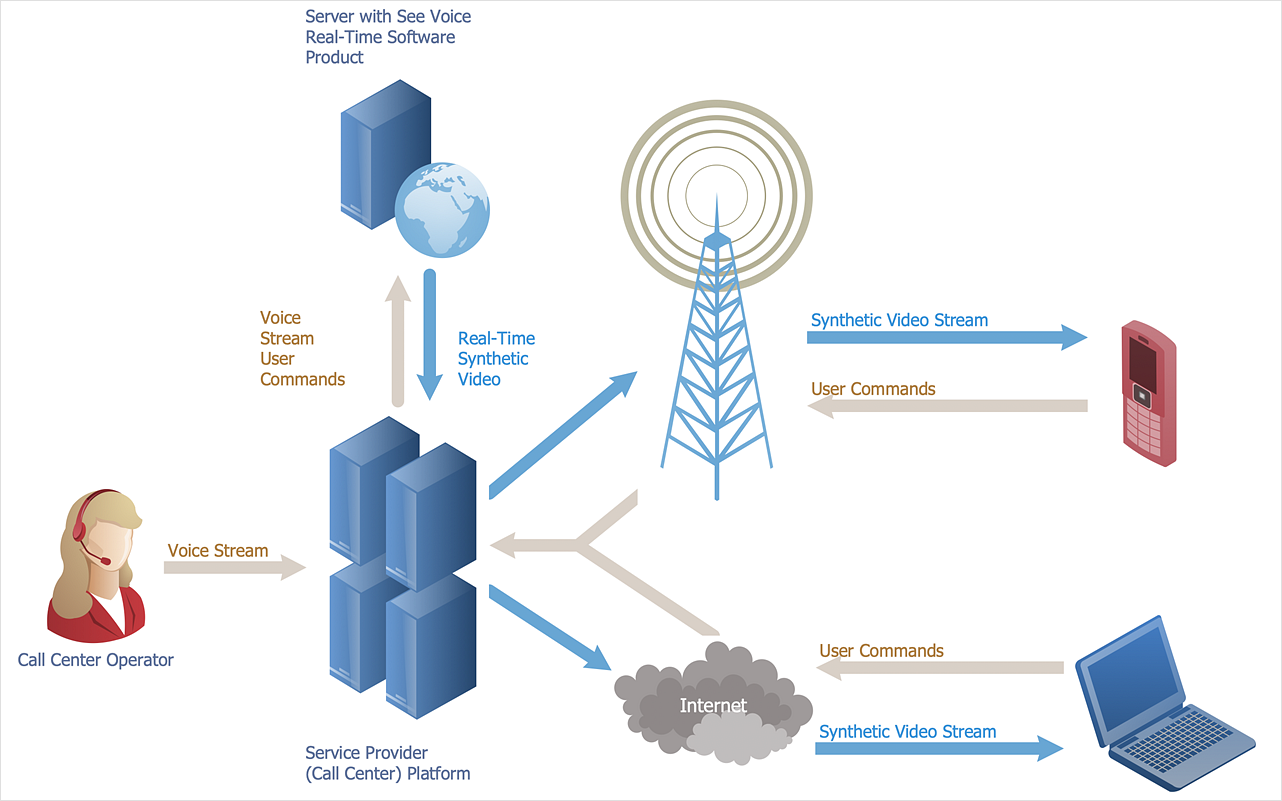
Telecommunication network diagram displays components and connections in a telecommunication network: how they are interacted between each other and with end-users. Telecommunication network diagrams usually created by system engineers for planning telecom networks. Also, they may be useful for a network management. Telecom network diagram visualizes the level of security and user access to certain equipment and data within a current network. Telecom network diagram can be used to identify weak points of an entire network or a part of it. ConceptDraw DIAGRAM allows you to draw a simple and clear Telecommunication Network diagrams.HelpDesk
How to Create a Data Flow Diagram
Data flow diagramming is a highly effective technique for showing the flow of information through a system. Data flow diagrams reveal relationships among and between the various components in a program or system. DFD is an important technique for modeling a system’s high-level detail by showing how input data is transformed to output results through a sequence of functional transformations. The set of standard symbols is used to depict how these components interact in a system. ConceptDraw DIAGRAM allows you to draw a simple and clear Data Flow Diagram using special libraries.HelpDesk
How to Create a Picture Graph
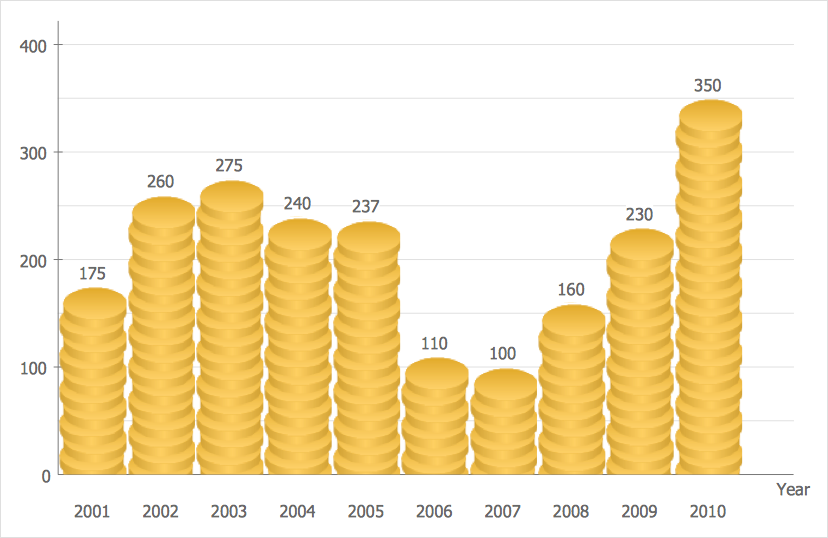
Picture Graphs are used commonly to represent non-complex data to a large audience. A Picture Graph is a simple kind of marketing diagram used to show the relationship among various quantities. It includes pictures or symbols to represent information visually. There are many cases when you have just some numbers to show and compare. This is not a reason to not use visual tools. You can produce a simple picture graph using memorable symbols to get the best visual presentation. Using specific symbols instead of regular colored bars makes picture graphs a much more descriptive tool. You can use tools from an existing library or find appropriate clipart in ConceptDraw’s collection. ConceptDraw DIAGRAM allows you to draw a simple and easy to understand Picture Charts using the special library.HelpDesk
How to Draw a Pie Chart
A pie chart represents data, in a clear and easy to read around (pie) form. A circular pie chart is divided into sections (slice). Each "slice" depicts the It reflects the proportion of each component in the whole "pie". This type of chart is most often used for the visualization of statistical data. That is why pie charts are widely used in marketing. As the pie charts show proportional parts of a whole, they are good for various visual comparisons. For example, it is difficult to imagine a more intuitive way to show segmentation and market share. ConceptDraw DIAGRAM allows you to draw a simple and clear Pie Chart using the Pie Charts solution.HelpDesk
How to Draw an Area Chart
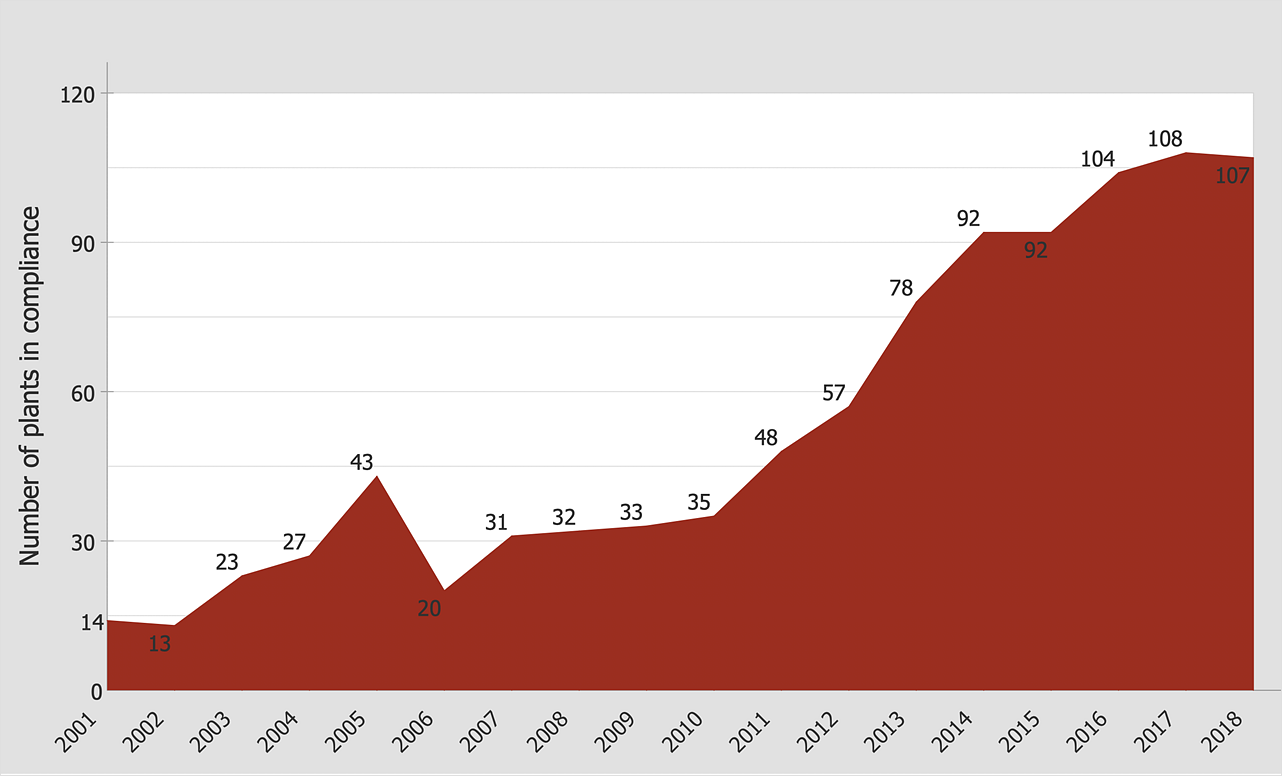
An area chart is similar to a line chart, but an area chart has an area, commonly filled with color below the line. The applying of Line charts and area charts are also very similar. They both show continuity across a data set. They are both can be used for displaying time series data and for depicting tendencies better than separate values, but they have some different characteristics. Using the proper one is good chance to show once again professionalism of your graphics documents. An area chart depicts a colored area below the line. The sum on the vertical axis of an area chart represents the entire value, while the height of each separate piece shows its parts. Area charts are used to display multiple data series with proportion to a whole value, or for separate data series showing a set of countable values, or cumulative data.HelpDesk
How to Create a Directional Map
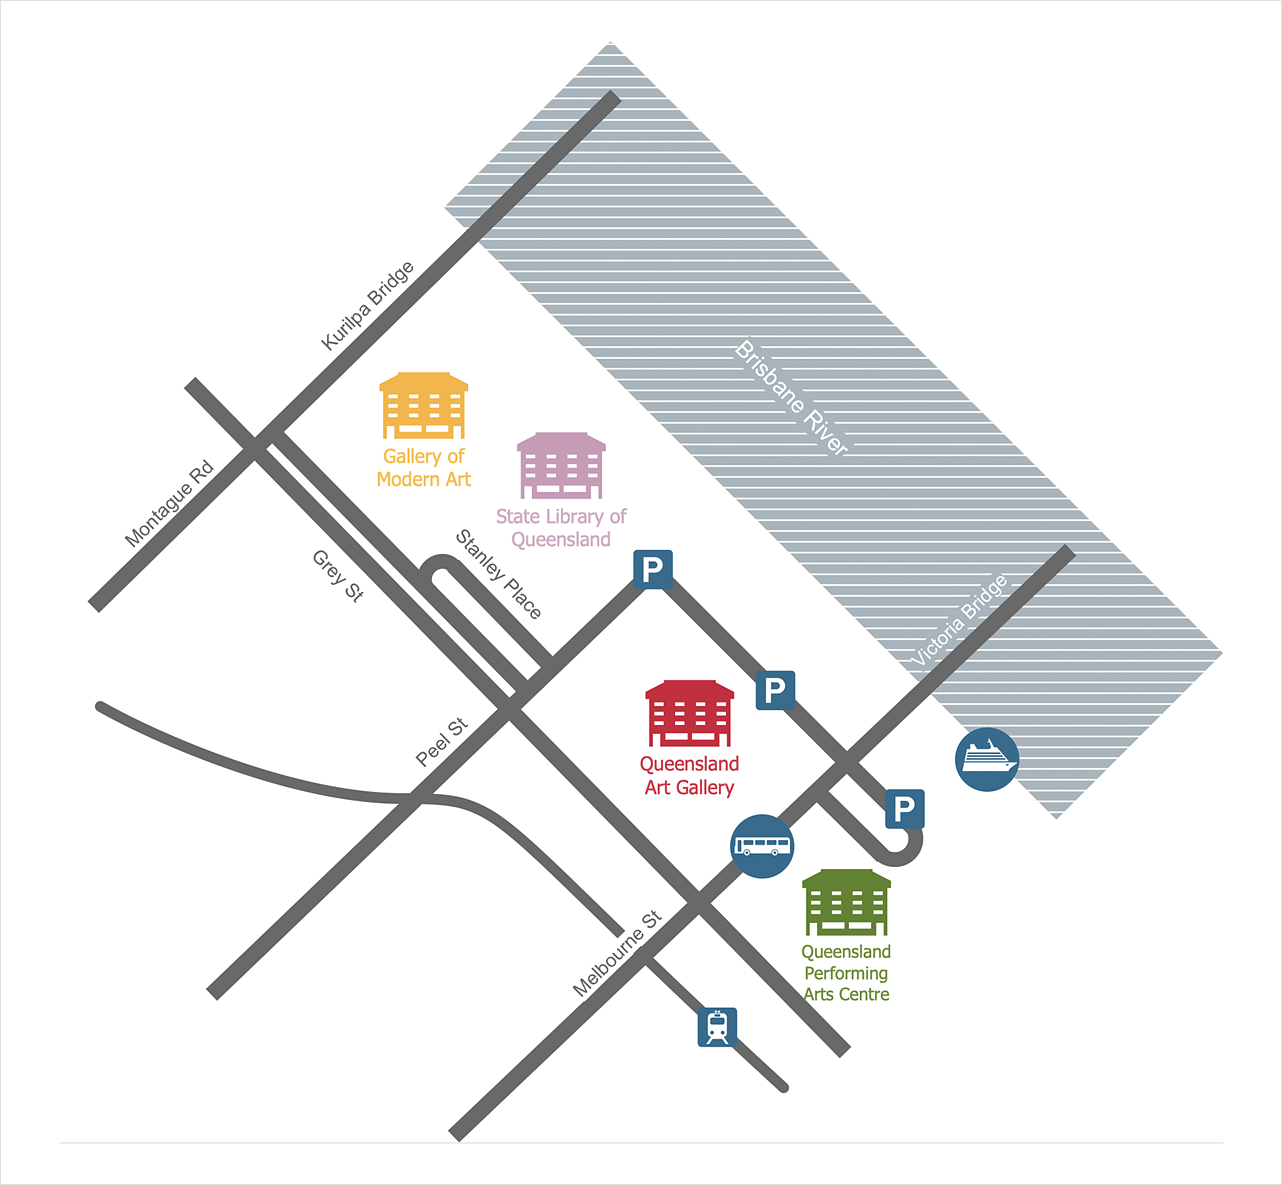
Travelers often use directional maps to find directions for certain places. These maps are guiding millions of tourists to explore towns and cities worldwide. Searching addresses on a map, view nearby businesses, get driving directions - this is only a little of what directional maps is needed. ConceptDraw DIAGRAM allows you to create various kinds of directional maps. You can easily visualize city maps or destinations with driving directions and traveler information using special vector stencils libraries.- How to Draw a Computer Network Diagrams | Network Diagram ...
- Diagram of a Basic Computer Network . Computer Network Diagram ...
- Network Topology | Basic Network Diagram | Cisco Network ...
- Basic computer network diagram | How to Draw a Computer ...
- Computer Network Topology
- Draw A Simple Computer Network Draft The Network Is Made Of ...
- Using A Diagram Simple Design Of Lan
- Draw A Simple Telecommunication Network
- Basic Network Diagram | Local area network ( LAN ). Computer and ...
- Construct A Simple Sketch Of A Computer File Structure
- Draw A Simple Computer File Structure
- How to Draw a Computer Network Diagrams
- Draw A Computer File Structure
- Construct A Simple Sketch Of Computer File Structure
- Network Topologies | Tree Network Topology Diagram | Fully ...
- How to Draw a Computer Network Diagrams | Process Flowchart ...
- Draw A Simple Schematic Diagram Of A Computer Connected To A
- How to Draw a Computer Network Diagrams | Network diagrams ...
- Draw A Simple Design Diagram Of A Local Area Network Including
- Computer Network Diagrams | Telecommunication Network ...


