HelpDesk
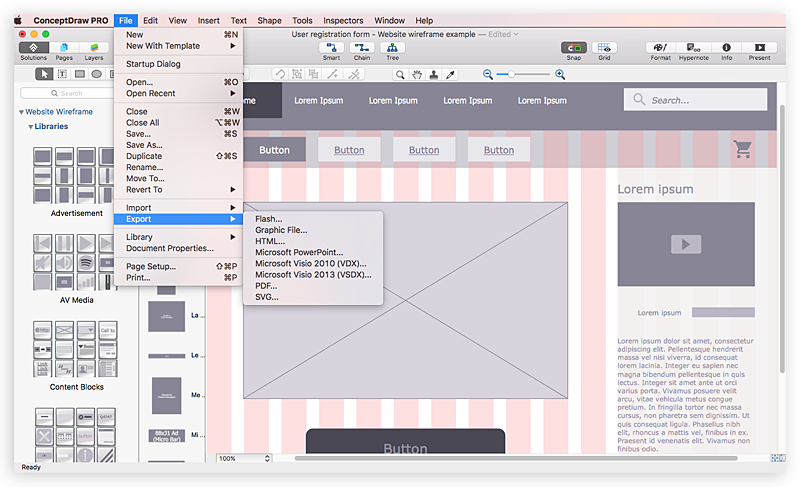
How to Develop Website Wireframes Using ConceptDraw PRO
Website design is a rather complicated process. The development of a website wireframe is an important step in any screen design process. The first step of this process before coding can start, web designer creates a website wireframe — a mock-up for what will be displayed on the screen when navigating through the web site pages. A wireframe design always includes three components:Information design, navigation design and interface design. The configuration of these components depends on the business model of the website. The Website Wireframing tools provided with ConceptDraw Website Wireframe solution helps to define the information hierarchy of website design, making it easier for web-developers to plan the layout according to how a site visitor have to process the information.HelpDesk
How to Quickly Make a Project from a Mind Map
ConceptDraw MINDMAP allows you to view your mind map as a Gantt chart. You can do this by opening your map in ConceptDraw PROJECT. It is possible to proceed the same file in both ConceptDraw MINDMAP and ConceptDraw PROJECT.HelpDesk
How to Draw a Pyramid Diagram in ConceptDraw PRO
Pyramid diagram (triangle diagram) is used to represent data, which have hierarchy and basics. Due to the triangular form of diagram, each pyramid section has a different width. The width of the segment shows the level of its hierarchy. Typically, the top of the pyramid is the data that are more important than the base data. Pyramid scheme can be used to show proportional and hierarchical relationships between some logically related items, such as departments within an organization, or successive elements of any process. This type of diagram is often used in marketing to display hierarchical related data, but it can be used in a variety of situations. ConceptDraw PRO allows you to make a pyramid diagram, quickly and easily using special libraries.Internet solutions with ConceptDraw PRO
ConceptDraw is a good means of visualization of information of any kind as it features powerful graphic capabilities. The conception of using ConceptDraw and open formats by the programs that work with Internet can be used for displaying any data and any structure in Internet.
 ConceptDraw Solution Park
ConceptDraw Solution Park collects graphic extensions, examples and learning materials
HelpDesk
Accounting Information Systems Flowchart Symbols
Accounting Information system is a combination of software and hardware, as well as organizational support. Information system - it is not only the software and computers with network equipment, but also a list of instructions and standards which can be notated using Accounting information systems flowchart symbols. All information systems can be divided into information retrieval and data processing systems. Data Flow model is a hierarchical model. Each process can be divided into structural components, that depict by corresponding flowchart symbols, showing the accounting information system in communication with the external environment. The major components of accounting information systems flowchart are: entities, processes, data stores, and data flows. The set of standard accounting information flowchart symbols is intended to show the relationships between the system components. ConceptDraw PRO can help to draw clear accounting information system diagrams using special flowchart symbols.Managing the task list
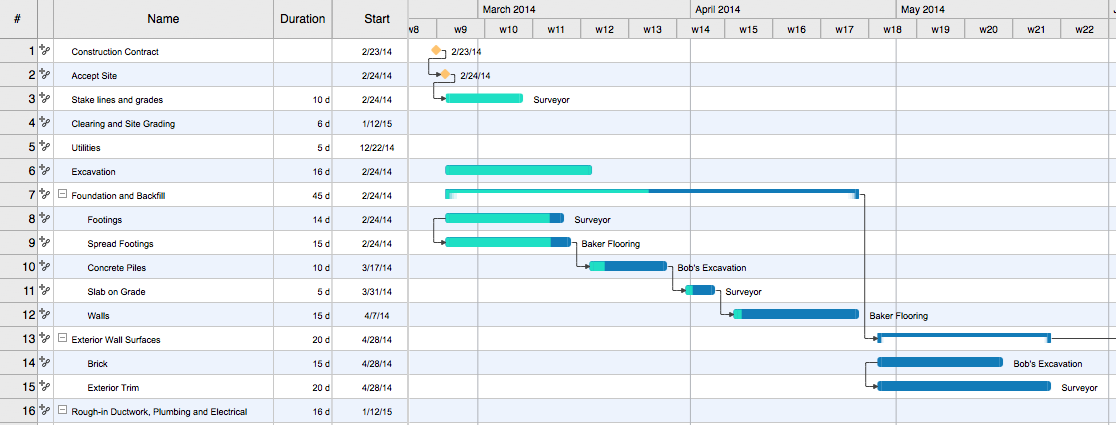
Four lessons explaining how to manage your task list in a Gantt chart. You will learn how to adjust your Gantt chart view, how to add/delete tasks or subtasks, how to change tasks hierarchy, how to show/hide subtasks.- Process Flowchart | ConceptDraw Solution Park | Databases Access ...
- 4 Level pyramid model diagram - Information systems types | 5 Level ...
- Chart Of Management Information System With Diagram
- Draw Up A Hierarchy Of The Information System Department
- How to Draw an Organization Chart | Organizational Charts | How to ...
- Pyramid Diagram | Pyramid Diagram | How to Draw a Pyramid ...
- Draw And Label The Diagram Of An Information Triangle
- Three Levels Management Information System
- Enterprise Architecture Diagrams | Business Architecture ...
- 4 Level pyramid model diagram - Information systems types ...
- How to Draw an Organization Chart | Organizational Structure ...
- 4 Level pyramid model diagram - Information systems types | 5 Level ...
- 5 Level pyramid model diagram - Information systems types | 4 Level ...
- Pyramid Diagram | 4 Level pyramid model diagram - Information ...
- Pyramid Diagram | 5 Level pyramid model diagram - Information ...
- Organizational Structure | Active Directory Domain Services diagram ...
- Management Information System Triangle Diagram
- 4 Level pyramid model diagram - Information systems types ...
- 4 Level pyramid model diagram - Information systems types | Types ...
- Draw Up A Diagram Show A 3level Of Management With Dicesion


