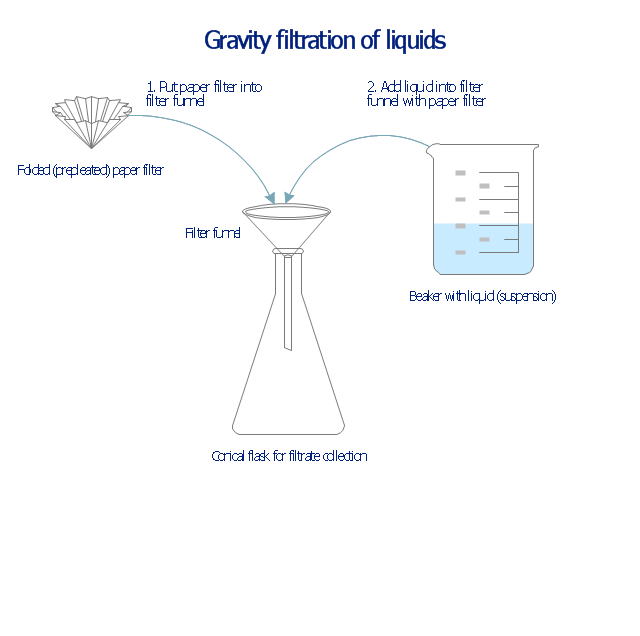
This chemical laboratory technique drawing depict gravity filtration of liquid through prepleated paper filter step-by-step.
1. Put folded filter paper cone into glass filter funnel inserted into neck of conical (Erlenmeyer) flask.
2. Add liquid suspension from the glass beaker with a spout into the funnel with paper filter.
3. Collect filtrate in the conical flask and solid on the paper filter in the funnel.
"Filtration is commonly the mechanical or physical operation which is used for the separation of solids from fluids (liquids or gases) by interposing a medium through which only the fluid can pass. The fluid that pass through is called a filtrate. Oversize solids in the fluid are retained, but the separation is not complete; solids will be contaminated with some fluid and filtrate will contain fine particles (depending on the pore size and filter thickness)." [Filtration. Wikipedia]
"Filter paper is a semi-permeable paper barrier placed perpendicular to a liquid or air flow. It is used to separate fine solids from liquids or air." [Filter paper. Wikipedia]
The chemical lab drawing example "Gravity filtration of liquids" was created using the ConceptDraw PRO diagramming and vector drawing software extended with the Chemistry solution from the Science and Education area of ConceptDraw Solution Park.
Liquid filtration through filter paper
 Cross-Functional Flowcharts
Cross-functional flowcharts are powerful and useful tool for visualizing and analyzing complex business processes which requires involvement of multiple people, teams or even departments. They let clearly represent a sequence of the process steps, the order of operations, relationships between processes and responsible functional units (such as departments or positions).
Relationships Analysis


This PFD sample was redesigned from the Wikipedia file: NaturalGasCondensate.png.
"This is a schematic flow diagram of a typical facility for separating and recovering liquid condensate from raw natural gas."
[en.wikipedia.org/ wiki/ File:NaturalGasCondensate.png]
"Natural-gas condensate is a low-density mixture of hydrocarbon liquids that are present as gaseous components in the raw natural gas produced from many natural gas fields. It condenses out of the raw gas if the temperature is reduced to below the hydrocarbon dew point temperature of the raw gas.
The natural gas condensate is also referred to as simply condensate, or gas condensate, or sometimes natural gasoline because it contains hydrocarbons within the gasoline boiling range. Raw natural gas may come from any one of three types of gas wells:
(1) Crude oil wells - Raw natural gas that comes from crude oil wells is called associated gas. This gas can exist separate from the crude oil in the underground formation, or dissolved in the crude oil.
(2) Dry gas wells - These wells typically produce only raw natural gas that does not contain any hydrocarbon liquids. Such gas is called non-associated gas.
(3) Condensate wells - These wells produce raw natural gas along with natural gas liquid. Such gas is also non-associated gas and often referred to as wet gas." [Natural-gas condensate. Wikipedia]
The process flow diagram example "Natural gas condensate - PFD" was drawn using the ConceptDraw PRO software extended with the Chemical and Process Engineering solution from the Chemical and Process Engineering area of ConceptDraw Solution Park.
Process flow diagram (PFD)
-natural-gas-condensate---pfd.png--diagram-flowchart-example.png)
- Drawing Of Separation Technique
- Gravity filtration of liquids | Draw A Diagram Of Gravity Filtration ...
- What Is Filtration Draw And Label A Diagram Showing Filtration
- Gravity filtration of liquids | Diagram Of Gravity Filtration Techniques
- Filtration Labelled Diagram
- Laboratory Apparatus For Separation Techniques
- Draw Separation Technique Apparatus
- Gravity filtration of liquids | Chemistry | Chemistry Symbols and ...
- Electrical Drawing Software and Electrical Symbols | Human ...
- Labelled Diagram Of Filtration
- Filtration Apparatus And Technique
- Diagram Of Filter Paper
- Apparatus Used In Separating Techniques
- Draw Filter Paper
- Chemistry | Chemistry Symbols and Meanings | Diagram Of Filtration ...
- The Working Drawing Of A Funnel
- Laboratory equipment - Vector stencils library | Chemistry Drawing ...
- Gravity filtration of liquids | Glassware In Science Labs
- Gravity filtration of liquids | Laboratory equipment - Vector stencils ...
- Gravity filtration of liquids | Chemistry Symbols and Meanings ...