 ATM UML Diagrams
The ATM UML Diagrams solution lets you create ATM solutions and UML examples. Use ConceptDraw PRO as a UML diagram creator to visualize a banking system.
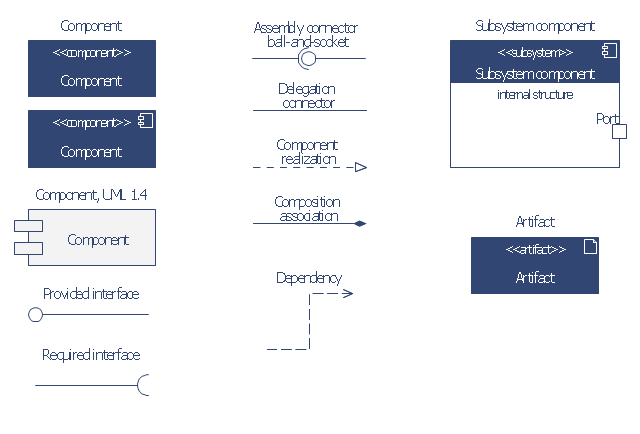
The vector stencils library "Bank UML component diagram" contains 13 shapes for drawing UML component diagrams.
Use it for object-oriented modeling of your bank information system.
"A component is something required to execute a stereotype function. Examples of stereotypes in components include executables, documents, database tables, files, and library files.
Components are wired together by using an assembly connector to connect the required interface of one component with the provided interface of another component. This illustrates the service consumer - service provider relationship between the two components. ...
When using a component diagram to show the internal structure of a component, the provided and required interfaces of the encompassing component can delegate to the corresponding interfaces of the contained components. ...
Symbols.
This may have a visual stereotype in the top right of the rectangle of a small rectangle with two even smaller rectangles jutting out on the left.
The lollipop, a small circle on a stick represents an implemented or provided interface. The socket symbol is a semicircle on a stick that can fit around the lollipop. This socket is a dependency or needed interface." [Component diagram. Wikipedia]
This example of UML component diagram symbols for the ConceptDraw PRO diagramming and vector drawing software is included in the ATM UML Diagrams solution from the Software Development area of ConceptDraw Solution Park.
UML component diagram symbols
HelpDesk
How to Create a Bank ATM Use Case Diagram

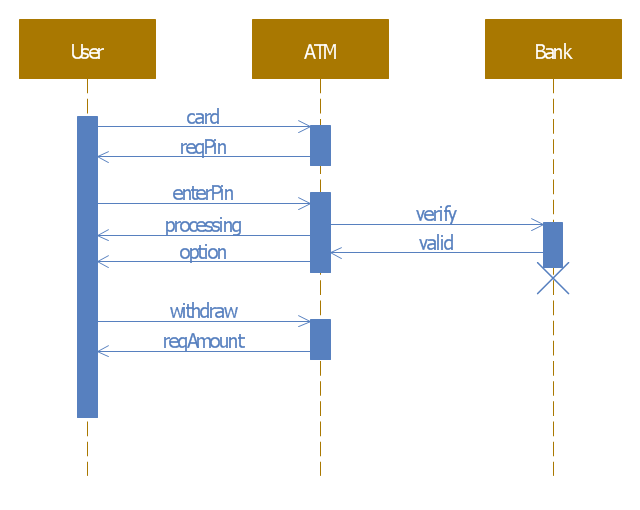
This example of automated teller machine (ATM) UML sequence diagram was created on the base of figure 5 "Sequence diagram" on the webpage "Message Sequence Charts and their Ilk" from the website of the University of California Irvine (UCI) Donald Bren School of Information and Computer Sciences.
"A UML sequence diagram or SD is similar to an MSC but written with a different notation. Presumably the same semantic issues arise, but possibly not since UML semantics are not well-defined. An example is shown in Figure 5.
The timelines are dotted rather than solid, and the name of the component is inside a box at the head of each timeline. The narrow rectangles apparently show when a component is active (unsure precisely what "active" means). An X on a timeline indicates that the component ceases to exist in some sense (unsure precisely how this is meant also). In the example, the Bank timeline has an X simply as an example (presumably the Bank does continue to exist)."
[www.ics.uci.edu/ ~alspaugh/ cls/ shr/ msc.html]
This example of bank ATM sequence diagram was created using the ConceptDraw PRO diagramming and vector drawing software extended with the ATM UML Diagrams solution from the Software Development area of ConceptDraw Solution Park.
Bank ATM UML sequence diagram
 Rapid UML
Rapid UML solution extends ConceptDraw PRO software with templates, samples and libraries of vector stencils for quick drawing the UML diagrams using Rapid Draw technology.
 Rapid UML
Rapid UML solution extends ConceptDraw PRO software with templates, samples and libraries of vector stencils for quick drawing the UML diagrams using Rapid Draw technology.
 Computer Network Diagrams
Computer Network Diagrams solution extends ConceptDraw PRO software with samples, templates and libraries of vector stencils for drawing the computer network topology diagrams.
 Event-driven Process Chain Diagrams
Event-driven Process Chain (EPC) Diagram is a type of flowchart widely used for modeling in business engineering and reengineering, business process improvement, and analysis. EPC method was developed within the Architecture of Integrated Information Systems (ARIS) framework.
 AWS Architecture Diagrams
The flexible AWS cloud solutions will help you to create reliable applications with a high level of scaling in the AWS cloud, to run your applications and accelerate their work on the level of security. Besides AWS resources are available worldwide and yo
 Business Process Diagrams
Business Process Diagrams solution extends the ConceptDraw PRO BPM software with RapidDraw interface, templates, samples and numerous libraries based on the BPMN 1.2 and BPMN 2.0 standards, which give you the possibility to visualize equally easy simple and complex processes, to design business models, to quickly develop and document in details any business processes on the stages of project’s planning and implementation.
 Entity-Relationship Diagram (ERD)
Entity-Relationship Diagram (ERD) solution extends ConceptDraw PRO software with templates, samples and libraries of vector stencils from drawing the ER-diagrams by Chen's and crow’s foot notations.
 Venn Diagrams
Venn Diagrams are actively used to illustrate simple set relationships in set theory and probability theory, logic and statistics, mathematics and computer science, linguistics, sociology, and marketing. Venn Diagrams are also often used to visually summarize the status and future viability of a project.
- UML Component for Bank | Rapid UML | UML Deployment Diagram ...
- UML Deployment Diagram Example - ATM System | UML ...
- UML Deployment Diagram Example - ATM System | UML Diagram ...
- UML Component Diagram | Diagramming Software for Design UML ...
- UML Deployment Diagram Example - ATM System | ATM UML ...
- UML Deployment Diagram Example - ATM System | ATM UML ...
- UML Deployment Diagram Example - ATM System | Enterprise ...
- UML Deployment Diagram
- UML Deployment Diagram Example - ATM System | Design ...
- UML Deployment Diagram | Diagramming Software for Design UML ...
- UML Deployment Diagram Example - ATM System | UML Use Case ...
- UML Deployment Diagram Example - ATM System | UML Use Case ...
- UML Deployment Diagram Example - ATM System | UML Use Case ...
- UML activity diagram - Cash withdrawal from ATM | Entity ...
- UML Deployment Diagram Example - ATM System | UML Use Case ...
- UML Deployment Diagram Example - ATM System | Rapid UML ...
- Component Diagram In Uml For Banking System
- Diagramming Software for Design UML Component Diagrams | UML ...
- UML Component Diagram. Design Elements | Diagramming ...
- UML Deployment Diagram Example - ATM System | UML ...