How can you illustrate the weather condition
Use it to make professional looking documents, presentations, and websites illustrated with color scalable vector clipart for geography, weather, and animals.HelpDesk
How to Draw a Pie Chart Using ConceptDraw PRO
A pie chart represents data, in a clear and easy to read round (pie) form. A circular pie chart is divided into sections (slice). Each "slice" depicts the It reflects the proportion of each component in the whole "pie". This type of chart is most often used for the visualization of statistical data. That is why pie charts are widely used in marketing. As pie charts show proportional proportional parts of a whole, they are good for various visual comparisons. For example, it is difficult to imagine a more intuitive way to show segmentation and market share. ConceptDraw PRO allows you to draw a simple and clear Pie Chart using the Pie Charts solution.HelpDesk
How to Draw a Gantt Chart Using ConceptDraw PRO
A Gantt chart is intended to provide a visualization of a project schedule. It is developed to help planning, coordinating, and tracking on project tasks implementation. One of the most critical resources for a project implementation is a time resources. Gantt chart - is one of the most convenient and popular way of graphical representation of a project tasks progress in conjunction with the corresponding time consumption. Gantt chart's function is to show project tasks completion in a progress, and to make a project manager sure that project tasks were completed on time. ConceptDraw Office is a clear and easy-to-use tool for project management. It is a very handy visual tool that helps make a project processing clear.HelpDesk
How to Draw a Pictorial Chart in ConceptDraw PRO
Pictorial Infographics is used to visually present data comparison. Pictorial charts use relative sizes or repetitions of the same icon, picture, or symbol to show data relation. Using a Pictorial chart to show business data patterns and trends will add much more efficiency to your business communications. Finding the right tool for the job can sometimes be tricky. Developing sophisticated and effective infographics can require toolsthat may span many different products. Fortunately, ConceptDraw PRO has everything you need to create polished Pictorial Infographics that beautifully and accurately represent your story, no matter how complex it may be.HelpDesk
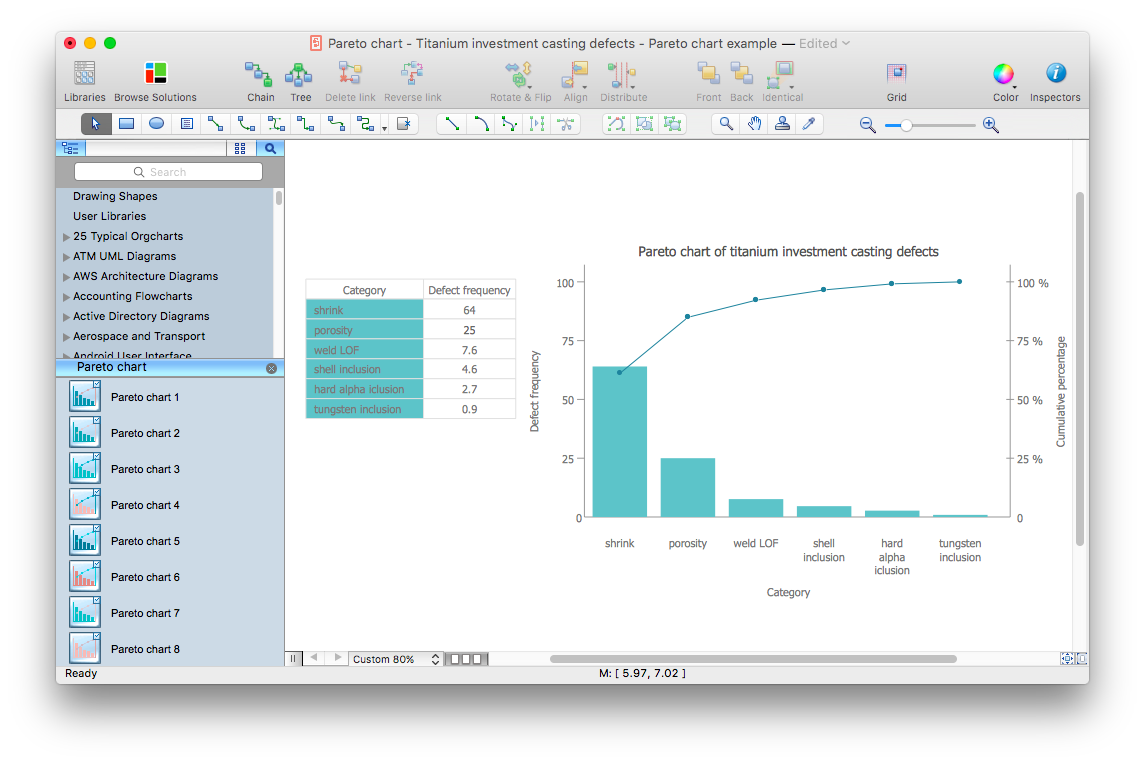
How to Draw a Pareto Chart Using ConceptDraw PRO
The Seven Basic Tools of Quality were picked as effective visual tool-set for identifying the root cause of quality-related problems within the workplace. Seven Basic Tools of Quality comprise of seven diagram that are diverse enough to be used to any business troubleshooting scenario, but simple enough that employees of all types can understand and apply them. One of these tools is a Pareto chart. It combines both a line graph and a bar chart, where the bar chart displays data values, and a line represents a total value. Pareto chart is used for quality control to identify the source of the quality problem. ConceptDraw Seven Basic Tools of Quality solution delivers a big set of vector stencil libraries and samples for each quality control diagram, including a Pareto chart.- How to Draw an Organization Chart | Organizational Structure ...
- Draw An Organizational Chart To Illustrate Individual And
- Draw An Organisational Chart To Illustrate Individual And
- Draw Organisational Chart To Illustrate Individual And Organization
- Draw A Pie Chart To Illustrate The Comparision Of Air
- Www Draw An Organisational Chart To Illustrate Individual And
- Draw An Organizational Chart Illustrate Individual Organisation
- Percentage Pie Chart . Pie Chart Examples | Atmosphere air ...
- Draw An Organisational Chart To Illustrate Organisational Activities
- How can you illustrate the weather condition | Nature Drawings ...
- Draw The Organisational Chart And Illustrate Its Activities With The
- How to Draw an Organization Chart | Examples of Flowcharts, Org ...
- How to Draw the Different Types of Pie Charts | How to Create a Pie ...
- How to Draw an Organization Chart | ConceptDraw PRO ...
- Call Forwarding with ENUM | Flow Chart To Illustrate Enum
- Draw A Diagram To Illustrate Such As A Pyramid
- Draw An Organizational Chart To Illustrate Individual And
- Draw The Organizational Chart And Illustrate Its Activities
- Www Wath Is The Drawing On Organisational Chart Illustrate ...
- Marketing and Sales Organization chart . Organization chart ...


