Types of Flowcharts


"A chart can take a large variety of forms, however there are common features that provide the chart with its ability to extract meaning from data.
Typically the data in a chart is represented graphically, since humans are generally able to infer meaning from pictures quicker than from text. Text is generally used only to annotate the data.
One of the more important uses of text in a graph is the title. A graph's title usually appears above the main graphic and provides a succinct description of what the data in the graph refers to.
Dimensions in the data are often displayed on axes. If a horizontal and a vertical axis are used, they are usually referred to as the x-axis and y-axis respectively. Each axis will have a scale, denoted by periodic graduations and usually accompanied by numerical or categorical indications. Each axis will typically also have a label displayed outside or beside it, briefly describing the dimension represented. If the scale is numerical, the label will often be suffixed with the unit of that scale in parentheses. ...
Within the graph a grid of lines may appear to aid in the visual alignment of data. The grid can be enhanced by visually emphasizing the lines at regular or significant graduations. The emphasized lines are then called major grid lines and the remainder are minor grid lines.
The data of a chart can appear in all manner of formats, and may include individual textual labels describing the datum associated with the indicated position in the chart. The data may appear as dots or shapes, connected or unconnected, and in any combination of colors and patterns. Inferences or points of interest can be overlaid directly on the graph to further aid information extraction.
When the data appearing in a chart contains multiple variables, the chart may include a legend (also known as a key). A legend contains a list of the variables appearing in the chart and an example of their appearance. This information allows the data from each variable to be identified in the chart." [Chart. Wikipedia]
The vector stencils library "Time series charts" contains 10 templates: 3 column charts, 3 bar charts, 2 line graphs and 2 dot plots. All these charts are Live Objects displaying the data from external data source files.
Use these chart templates to design your business performance digital dashboards using the ConceptDraw PRO diagramming and vector drawing software.
The example "Design elements - Time series charts" is included in the Time Series Dashboard solution from the area "What is a Dashboard" of ConceptDraw Solution Park.
Time series charts

The vector stencils library "Geography" contains 14 clipart images of natural landscapes and water features for drawing illustrations.
"A natural landscape is a landscape that is unaffected by human activity. A natural landscape is intact when all living and nonliving elements are free to move and change. The nonliving elements distinguish a natural landscape from a wilderness. A wilderness includes areas within which natural processes operate without human interference, but a wilderness must contain life. As implied, a natural landscape may contain either the living or nonliving or both." [Natural landscape. Wikipedia]
The clip art example "Geography - Vector stencils library" was created using the ConceptDraw PRO diagramming and vector drawing software extended with the Nature solution from the Illustration area of ConceptDraw Solution Park.
www.conceptdraw.com/ solution-park/ illustrations-nature
Ocean

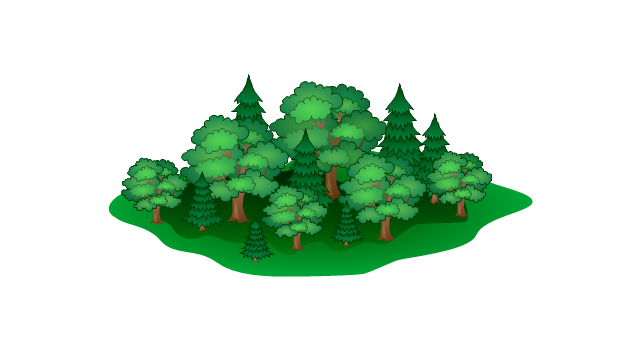
Forest
River

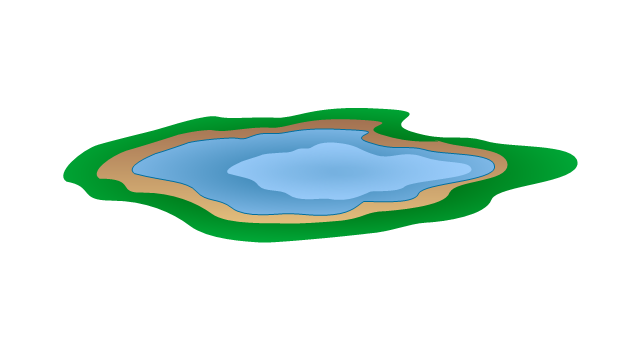
Lake
Waterfall

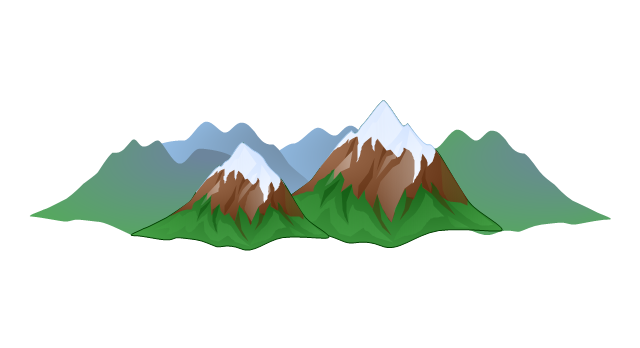
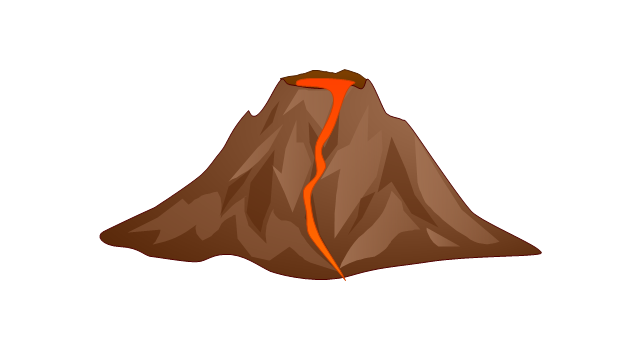
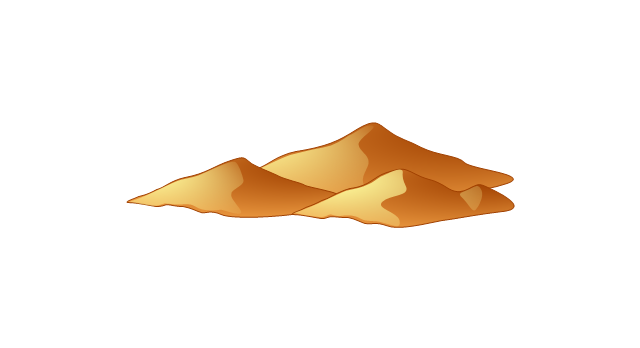
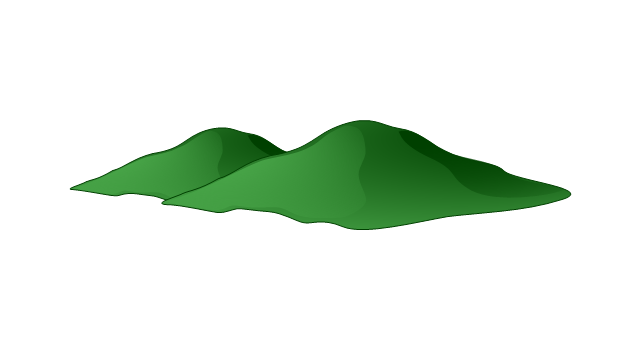
Mountains
Mountain

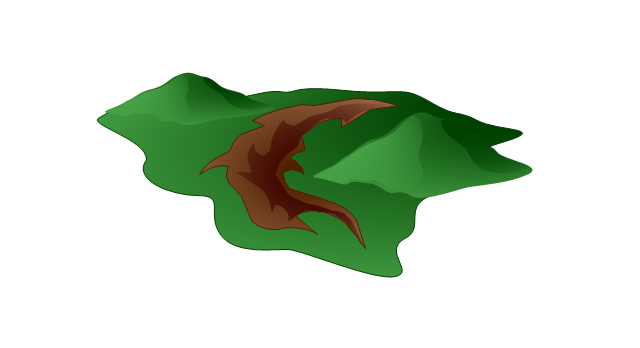
Ravine
Volcano
Desert
Hills
Iceberg

Conifer tree

Tree

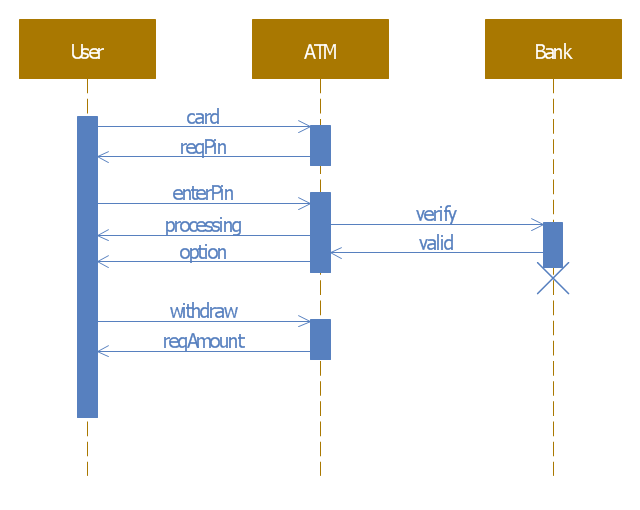
This example of automated teller machine (ATM) UML sequence diagram was created on the base of figure 5 "Sequence diagram" on the webpage "Message Sequence Charts and their Ilk" from the website of the University of California Irvine (UCI) Donald Bren School of Information and Computer Sciences.
"A UML sequence diagram or SD is similar to an MSC but written with a different notation. Presumably the same semantic issues arise, but possibly not since UML semantics are not well-defined. An example is shown in Figure 5.
The timelines are dotted rather than solid, and the name of the component is inside a box at the head of each timeline. The narrow rectangles apparently show when a component is active (unsure precisely what "active" means). An X on a timeline indicates that the component ceases to exist in some sense (unsure precisely how this is meant also). In the example, the Bank timeline has an X simply as an example (presumably the Bank does continue to exist)."
[www.ics.uci.edu/ ~alspaugh/ cls/ shr/ msc.html]
This example of bank ATM sequence diagram was created using the ConceptDraw PRO diagramming and vector drawing software extended with the ATM UML Diagrams solution from the Software Development area of ConceptDraw Solution Park.
Bank ATM UML sequence diagram
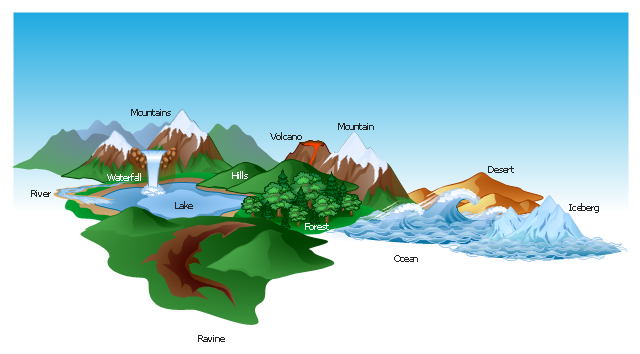
The vector clipart library Geography contains 14 images of geographical features: ocean, forest, river, lake, waterfall, mountains, ravine, volcano, desert, hills, iceberg, trees.
Use the design elements library Geography to draw illustrations with landform images using the ConceptDraw PRO diagramming and vector drawing software.
"A landform in the earth sciences comprises a geomorphological unit, and is largely defined by its surface form and location in the landscape. As part of the terrain a landform is an element of topography. Landform elements also include land such as hills, mountains, plateaus,canyons,valleys, seascape and oceanic waterbody interface features such as bays, peninsulas, seas and so forth, including sub-aqueous terrain features such as mid-ocean ridges, volcanoes,and the great ocean basins." [Landform. Wikipedia]
This landscape illustration example is included in the Nature solution from the Illustration area of ConceptDraw Solution Park.
Vector illustration
- Network Diagram Examples | Wan Network Diagram With Difination
- Network Diagram Software (PRO) | Satellite Difination
- Design Element: Basic Network for Network Diagrams | Network ...
- Man Defination And Diagram
- Star Network Topology | LAN topology diargam | Personal area ...
- Network Diagram Software. LAN Network Diagrams. Physical Office ...
- Basic Flowchart Symbols and Meaning
- Metropolitan area networks (MAN). Computer and Network Examples
- How to Draw a Divided Bar Chart in ConceptDraw PRO | Process ...
- Geography - Vector stencils library