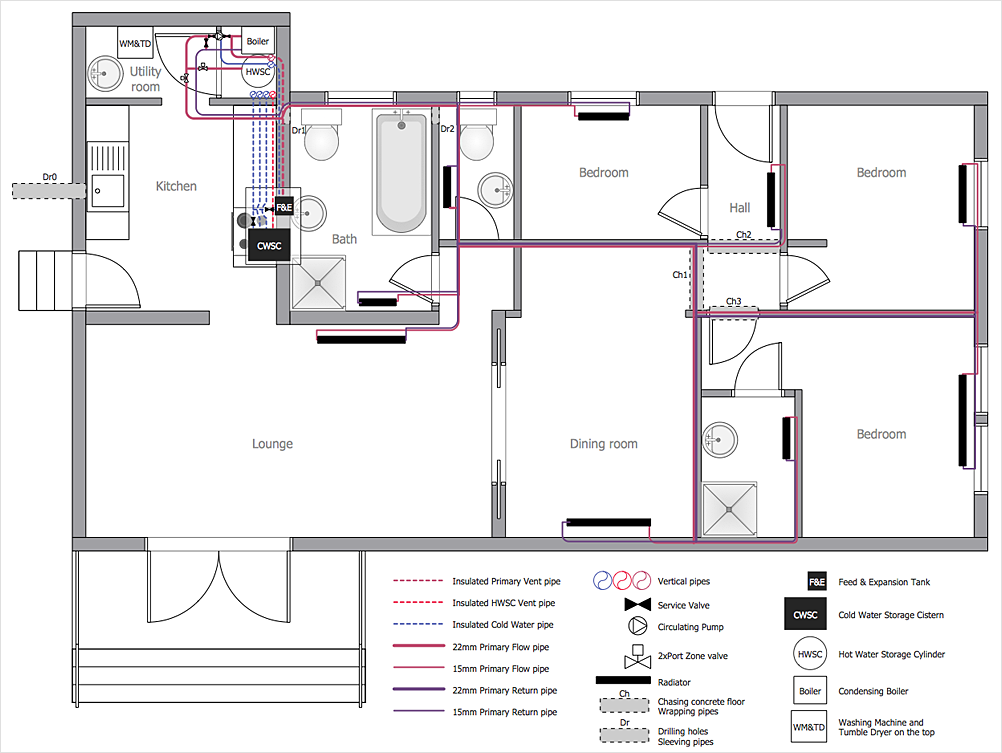
 Plumbing and Piping Plans
Plumbing and Piping Plans solution extends ConceptDraw DIAGRAM.2.2 software with samples, templates and libraries of pipes, plumbing, and valves design elements for developing of water and plumbing systems, and for drawing Plumbing plan, Piping plan, PVC Pipe plan, PVC Pipe furniture plan, Plumbing layout plan, Plumbing floor plan, Half pipe plans, Pipe bender plans.
Business diagrams & Org Charts with ConceptDraw DIAGRAM
The business diagrams are in great demand, they describe the business processes, business tasks and activities which are executed to achieve specific organizational and business goals, increase productivity, reduce costs and errors. They let research and better understand the business processes. ConceptDraw DIAGRAM is a powerful professional cross-platform business graphics and business flowcharting tool which contains hundreds of built-in collections of task-specific vector stencils and templates. They will help you to visualize and structure information, create various Business flowcharts, maps and diagrams with minimal efforts, and add them to your documents and presentations to make them successful. Among them are Data flow diagrams, Organization charts, Business process workflow diagrams, Audit flowcharts, Cause and Effect diagrams, IDEF business process diagrams, Cross-functional flowcharts, PERT charts, Timeline diagrams, Calendars, Marketing diagrams, Pyramids, Target diagrams, Venn diagrams, Comparison charts, Analysis charts, Dashboards, and many more. Being a cross-platform application, ConceptDraw DIAGRAM is very secure, handy, free of bloatware and one of the best alternatives to Visio for Mac users.
 ConceptDraw Solution Park
ConceptDraw Solution Park collects graphic extensions, examples and learning materials
HelpDesk
How to Create a Residential Plumbing Plan
Planning a construction, or making a building plan you have take into account the plumbing and piping peculiarities. You need to make plan that shows the layout and connection of pipers, location of plumbing equipment, etc. Even with a plan changes may be necessary as you work, but a well-done plumbing and piping plan surely makes your work much easier. CnceptDraw Plumbing and Piping Plans solution provides you with the ability to create plumbing and piping plan that use official plumbing symbols. Making detailed Plumbing and Piping Plan will save time and costs. Also, drawing the Plumbing and Piping layout helps you considered through the project in detail, which may enable you to detect things that be probably missed. At least it certainly will minimize visits to the plumbing supply store and save your money. A clear, professional-looking Plumbing and Piping Plan also will make your communication with a building contractor more productive.
 Seven Management and Planning Tools
Seven Management and Planning Tools solution extends ConceptDraw DIAGRAM and ConceptDraw MINDMAP with features, templates, samples and libraries of vector stencils for drawing management mind maps and diagrams.
 Seven Basic Tools of Quality
Manage quality control in the workplace, using fishbone diagrams, flowcharts, Pareto charts and histograms, provided by the Seven Basic Tools of Quality solution.
 Telecommunication Network Diagrams
Telecommunication Network Diagrams solution extends ConceptDraw DIAGRAM software with samples, templates, and great collection of vector stencils to help the specialists in a field of networks and telecommunications, as well as other users to create Computer systems networking and Telecommunication network diagrams for various fields, to organize the work of call centers, to design the GPRS networks and GPS navigational systems, mobile, satellite and hybrid communication networks, to construct the mobile TV networks and wireless broadband networks.
 Venn Diagrams
Venn Diagrams are actively used to illustrate simple set relationships in set theory and probability theory, logic and statistics, mathematics and computer science, linguistics, sociology, and marketing. Venn Diagrams are also often used to visually summarize the status and future viability of a project.
- Diagram Of Plumbing Tools
- Sketch Diagram Of Plumbing Tools
- Sketch Plumbing Tools
- Some Simple Sketch And Examples Of Plumbing Tool
- Plumbing Tool And Its Diagram
- Diagram Of Plumbering Tools
- Www Image Of Plumbing Tools
- Piping and Instrumentation Diagram Software | Interior Design Office ...
- Building Drawing Design Element: Piping Plan | Plumbing and ...
- Building Drawing Software for Designing Plumbing | Piping and ...
- Process Flowchart | Piping and Instrumentation Diagram Software ...
- Plumbing Diagram Software
- Piping and Instrumentation Diagram Software | Plumbing and Piping ...
- Residential Plumbing Diagram
- Plumbing and Piping Plans | IDEF9 Standard | Er Diagram Of ...
- Building Drawing Software for Designing Plumbing | Piping and ...
- ConceptDraw Solution Park | Divided Bar Diagrams | Plumbing and ...
- Building Drawing Software for Designing Plumbing | Building ...
- Piping and Instrumentation Diagram Software | Plumbing and Piping ...
- Piping and Instrumentation Diagram Software | Building Drawing ...

