Network Diagram Examples
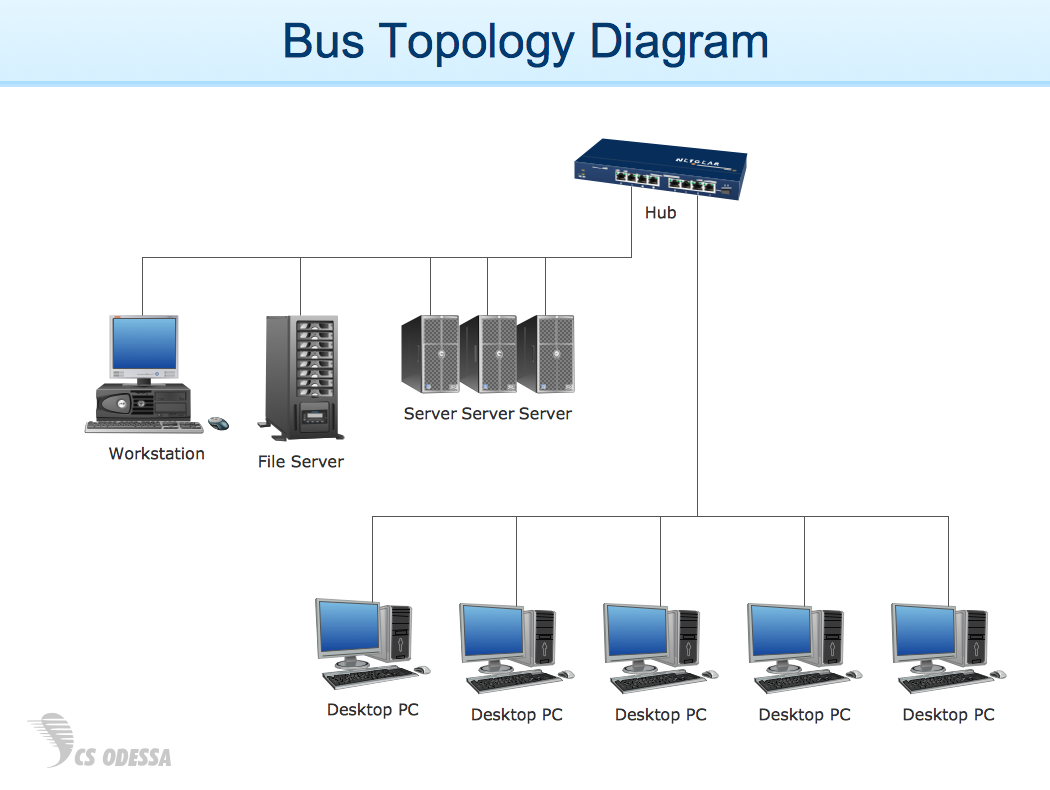
Network diagram is a chart which represents nodes and connections between them in computer network or any telecommunication network, it is a visual depiction of network architecture, physical or logical network topology. There are used common icons for the Network diagrams design, such as icons of various network appliances, computer devices, routers, clouds, peripheral devices, digital devices, etc. Network diagrams can represent networks of different scales (LAN level, WAN level) and detailization. ConceptDraw DIAGRAM diagramming software enhanced with Computer Network Diagrams solution from Computer and Networks area includes huge collection of computer and network templates, design objects and stencils, and numerous quantity of Network diagram examples and samples, among them: Basic Computer Network Diagrams, Communication Network Diagram, Wireless Router Network Diagram, LAN Topology Diagram, Computer Network System Design Diagram, Mobile Satellite Communication Network, Web-based Network Diagram, Hybrid Network Diagram, and many others.
 Rack Diagrams
The Rack Diagrams solution, including a vector stencil library, a collection of samples and a quick-start template, can be useful for all who deal with computer networks. Choosing any of the 54 library's vector shapes, you can design various types of Rack diagrams or Server rack diagrams visualizing 19" rack mounted computers and servers.
 Computer Network Diagrams
Computer Network Diagrams solution extends ConceptDraw DIAGRAM software with samples, templates and libraries of vector icons and objects of computer network devices and network components to help you create professional-looking Computer Network Diagrams, to plan simple home networks and complex computer network configurations for large buildings, to represent their schemes in a comprehensible graphical view, to document computer networks configurations, to depict the interactions between network's components, the used protocols and topologies, to represent physical and logical network structures, to compare visually different topologies and to depict their combinations, to represent in details the network structure with help of schemes, to study and analyze the network configurations, to communicate effectively to engineers, stakeholders and end-users, to track network working and troubleshoot, if necessary.
 Fishbone Diagrams
The Fishbone Diagrams solution extends ConceptDraw DIAGRAM software with the ability to easily draw the Fishbone Diagrams (Ishikawa Diagrams) to clearly see the cause and effect analysis and also problem solving. The vector graphic diagrams produced using this solution can be used in whitepapers, presentations, datasheets, posters, and published technical material.
 Fishbone Diagram
Fishbone Diagrams solution extends ConceptDraw DIAGRAM software with templates, samples and library of vector stencils for drawing the Ishikawa diagrams for cause and effect analysis.
 25 Typical Orgcharts
The 25 Typical Orgcharts solution contains powerful organizational structure and organizational management drawing tools, a variety of professionally designed organization chart and matrix organization structure samples, 25 templates based on various orga
- Organizational Structure | Organizational Structure Diagram ...
- Labelled Diagram Of Typical Networking Structure
- Wide area network (WAN) topology. Computer and Network ...
- Typical Computer Company Organization Structure With Diagram
- Logical network topology diagram | Local area network (LAN ...
- Flow Diagram That Shows The Management Structure In School
- 4 Level pyramid model diagram - Information systems types ...
- Computer Network Diagrams | Local area network (LAN). Computer ...
- Draw A Diagram Showing The Organisational Structure Of A School
- Illustrate By A Diagram To Show An An Organization Structure In
- Flow Diagram Of Schools Management Structure
- How to Draw an Organization Chart | ConceptDraw PRO ...
- Examples of Flowcharts, Org Charts and More | Basic Flowchart ...
- Organizational Structure Of A Computer Business Centre
- Typical Network Architecture Diagram
- Draw A Hierarchical Diagram Showing All The Overall Structure Of
- Organogram Software | UML Composite Structure Diagram ...
- Venn Diagram Examples for Problem Solving. Computer Science ...
- Typical Lan Schematic Wiring Diagram
- Wireless Network Topology | Star Network Topology | Hotel Network ...
